
.webp)
A/B Testing for Landing Pages: Step-by-Step Guide


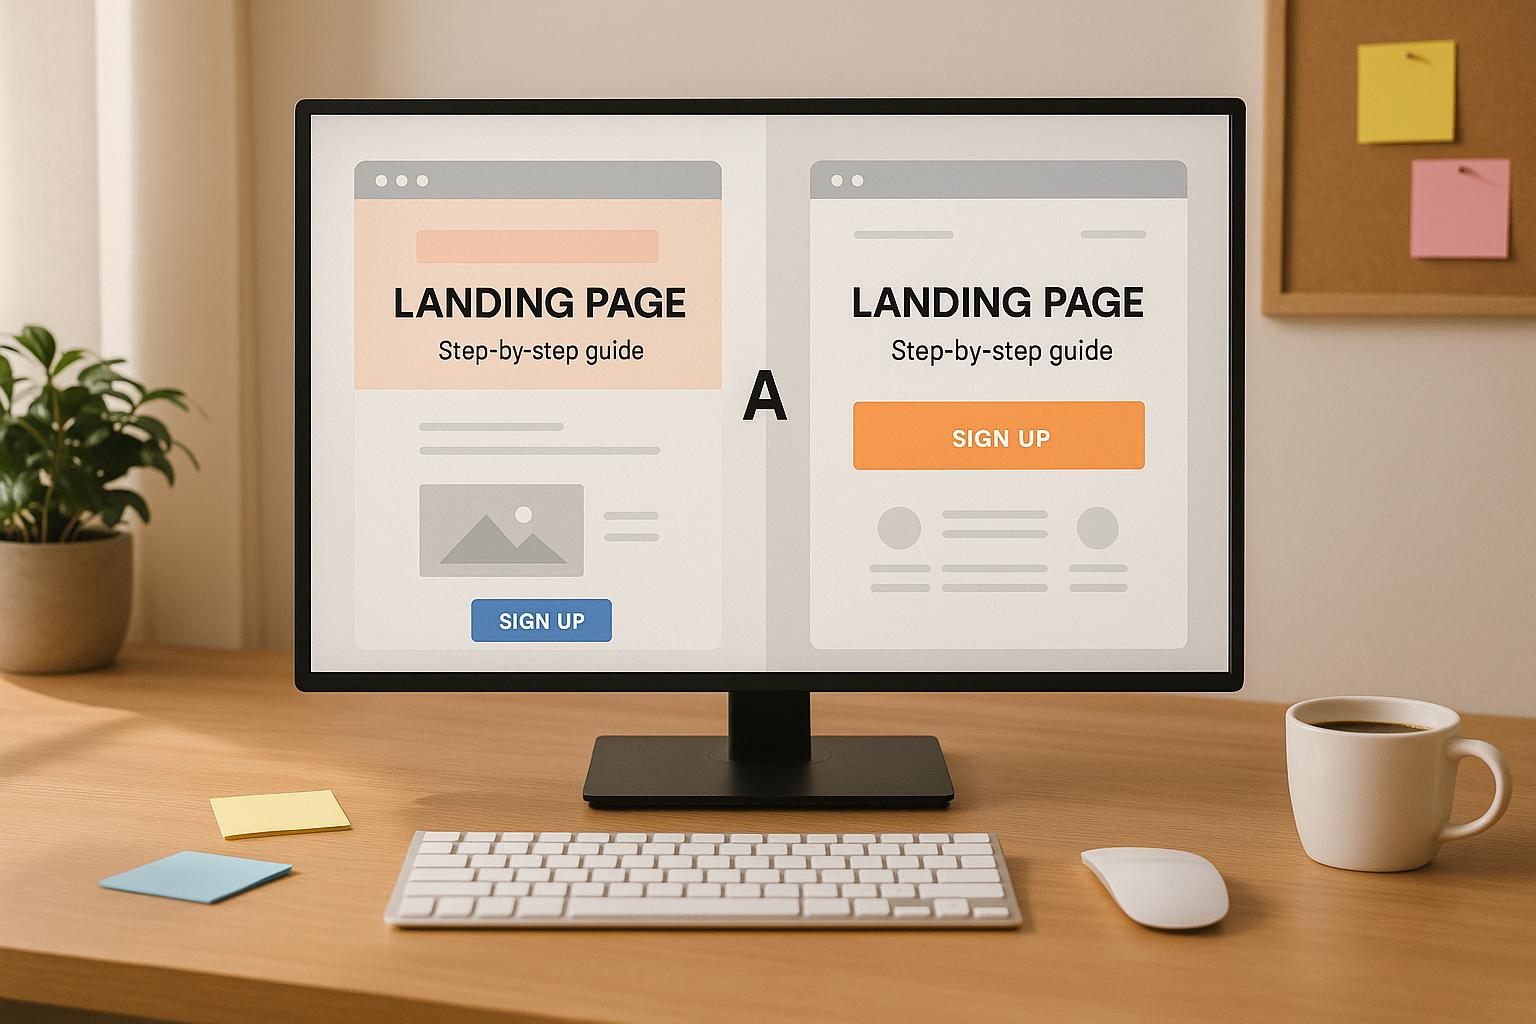
A/B testing is a method used to compare two versions of a landing page to determine which one performs better. By testing elements like headlines, images, or call-to-action buttons, you can make data-driven decisions to improve conversions and user experience. Here's how it works:
- What It Is: A/B testing involves creating a control version (A) and a variation (B), splitting traffic evenly between them, and analyzing performance metrics like conversions or click-through rates.
- Why It Matters: Even small changes can lead to big results. For example, shortening a form increased conversions by 13% for Truckers Report, while a new image helped WallMonkeys boost conversions by 27%.
- How to Start:
- Set clear goals (e.g., increase sign-ups or sales).
- Analyze your current page with tools like heat maps or session replays.
- Create a hypothesis based on data (e.g., "A shorter form will increase completions").
- Build and test a single variation to isolate results.
- Run the test for at least two weeks to ensure reliable data.
A/B testing isn't just about finding a "winner" - it's about understanding what resonates with your audience and optimizing your landing pages for better results. Start small, track your data carefully, and use tools like Google Analytics or Reform to simplify the process.
How to A/B Test Landing Pages With Google Optimize [FULL TUTORIAL]
Setting Up Your A/B Test
Laying the groundwork is key to running a successful A/B test. Here’s how to get started step by step.
Define Your Goals and Metrics
The first step is to determine exactly what you want to achieve. Is your goal to increase sign-ups, boost click-through rates, or drive more sales? Choose one primary objective to keep your results focused and clear.
Once your goal is established, decide on the specific metrics you’ll track. These metrics should leave no room for ambiguity and clearly indicate whether your changes are effective. For most landing pages, conversion rate is often the go-to metric. Axel Lavergne, Founder of Reviewflowz, emphasizes this point:
"Conversion rate is the most crucial metric. It measures how well your landing page converts visitors into leads or customers. At Reviewflowz, we noticed a stagnant conversion rate. By focusing on this metric, we implemented strategic improvements that resulted in an increase of 30% in three months."
Depending on your goals, you might monitor form completion rates, purchase conversions, or add-to-cart actions. And you’re not alone - 60% of businesses now test their landing pages, demonstrating the effectiveness of this strategy.
Analyze Current Performance
Before making improvements, you need to understand how your page is currently performing. Dive into analytics to review metrics like time on page, bounce rate, and conversion rates. For instance, if visitors leave quickly, it signals one issue. If they stay but don’t convert, that points to a different problem.
Heat maps can offer valuable insights here. They reveal where users click, move their cursor, and how far they scroll. This helps you identify areas of engagement versus areas that may need attention.
Session replays take this a step further, allowing you to watch real users interact with your page. These recordings can uncover friction points, confusing elements, or moments of hesitation.
A great example of this in action comes from WallMonkeys in 2024. After analyzing their homepage, they realized their generic stock photo wasn’t resonating with visitors. Swapping it for a playful, on-brand image led to a 27% jump in conversions. They also discovered their homepage slider was causing friction. Replacing it with a prominent search bar resulted in an astonishing 550% increase in conversions.
Create a Testable Hypothesis
A strong hypothesis acts as your blueprint for the test. It should clearly outline the problem you’ve identified, the solution you’re proposing, and the results you expect. Think of it as connecting the dots between your analysis and the changes you plan to make.
Your hypothesis should be specific, measurable, and based on data. Focus on altering just one variable at a time so you can pinpoint what drives the changes you observe.
Here’s how to structure a strong hypothesis: Start with your conversion goal and a problem statement based on your analysis. Then propose a solution and predict the results. For example, if customer feedback reveals your audience feels pressed for time and eye-tracking data shows the first bullet point gets the most attention, your hypothesis could be: “By tweaking the copy in the first bullet point to address the 'time issue,' I can encourage more visitors to download the ebook”.
Leverage tools like Google Analytics and heat maps to ensure your hypothesis is actionable and grounded in data. If your landing page includes forms, tools like Reform can help you test variables like form length, field arrangement, or submission processes to see what improves completion rates.
Each step - from setting goals to crafting a hypothesis - lays the groundwork for creating effective test variants. Once you have a clear hypothesis, you’re ready to move forward with building and launching your test.
Creating and Launching A/B Test Variants
With your hypothesis ready, the next step is to create the pages you'll test and make them live for visitors.
Build Control and Variant Pages
Your control page (version A) is the current landing page you're using - it serves as the baseline. The variant page (version B) includes the specific change you want to test based on your hypothesis. To get accurate results, change only one element per variant so you can clearly measure its impact.
Some common elements to experiment with include:
- Headlines
- Call-to-action buttons
- Images
- Form fields
- Page layouts
- Copy
For instance, if your goal is to increase form completions, you might test a shorter form against your existing longer one. If you're aiming to boost engagement, try replacing a generic stock photo with a branded image.
Gates Little, President/CEO of altLINE Sobanco, highlights the importance of this approach:
"A/B testing on a landing page with low traffic requires patience and a strategic approach. At altLINE, we focus on making significant changes that can potentially have a significant impact. This could be altering the layout or the wording of our main value proposition. We then allow sufficient time to gather meaningful data before making any conclusions."
Use Conversion-Focused Tools
Once your control and variant pages are ready, it’s time to use tools designed for conversion testing. Many platforms offer visual editors that let you modify page content without needing to code. Look for tools with user-friendly interfaces that simplify the testing process.
When selecting A/B testing tools, consider factors like:
- Ease of use
- Types of tests supported
- Targeting options
- Data analysis capabilities
- Integration with your existing tools
Pricing can vary - from monthly subscriptions to pay-as-you-go plans - so choose based on your budget and how often you plan to run tests.
If your landing page includes forms, Reform is a great option. This tool specializes in A/B testing for conversion optimization. You can test different form lengths, field arrangements, single-step versus multi-step forms, and submission processes to find the best-performing setup. Reform also provides real-time analytics to track your results instantly, while features like conditional routing and lead enrichment help you get the most out of every conversion.
Split Traffic Evenly
For fair testing, traffic must be distributed equally between your control and variant pages. Random sampling algorithms ensure visitors have an equal chance of seeing either version, which is critical for unbiased results.
"When a visitor arrives at a webpage where an A/B test is being conducted, a random sampling algorithm determines which version of the test they will be exposed to. This randomness ensures that each visitor has an equal chance of being assigned to either test version."
Keep an eye on traffic allocation throughout your test to make sure it stays balanced. Studies show that about 6% of experiments experience a sample ratio mismatch, where traffic isn’t evenly split as intended.
"In a typical A/B test, your traffic will be split evenly until you turn off the test."
Some platforms offer automatic traffic allocation, sending more visitors to the better-performing version over time. However, sticking to an even split until the test ends often provides clearer insights for future decisions.
Once your pages are set up and traffic is flowing evenly, you’re ready to monitor the results and gather data to refine your landing pages further.
sbb-itb-5f36581
Running and Monitoring the A/B Test
Once your control and variant pages are live, the next step is to keep a close eye on their performance. Running a successful A/B test requires patience, careful observation, and resisting the urge to make decisions too quickly.
Set the Right Test Duration
One common mistake in A/B testing is cutting the test short. While the general recommendation is to run tests for about two weeks, the exact duration depends on your specific goals and traffic levels. A two-week period helps account for variations in traffic and seasonal trends, giving you a more accurate picture. High-traffic sites may reach statistical significance faster, while lower-traffic pages might need more time. By running the test for at least two weeks, you can capture a complete business cycle and ensure your results are reliable. Alongside this, set up real-time monitoring to catch any issues early.
Track Performance in Real Time
Although you shouldn’t make decisions based on early data, real-time tracking is essential for spotting technical glitches or unusual patterns before they skew your results. Tools like real-time dashboards and automated alerts can help you monitor key metrics such as conversion rates, click-through rates, and revenue. Secondary metrics, like bounce rates and session durations, also provide valuable context. For form-based tests, platforms like Reform offer real-time analytics to track completion and abandonment trends. Double-check that all tracking mechanisms are functioning properly to avoid data errors.
Reach Statistical Significance
Once you've monitored performance, the next step is ensuring your results are statistically valid. Statistical significance confirms whether the changes you tested are responsible for the observed outcomes, rather than random chance. Aim for a 95% confidence level, which requires gathering enough data to confidently reject the null hypothesis. However, keep in mind that only about 20% of A/B tests reach this level, and just 1 in 7 tests result in a clear winner.
Cassie Kozyrkov, Chief Decision Scientist at Google, emphasizes the role of statistical significance:
"When we do hypothesis testing, we're always asking, does the evidence we collected make our null hypothesis look ridiculous? Yes or no? What the p-value does is provide an answer to that question. It tells you whether the evidence collected makes your null hypothesis look ridiculous. That's what it does, that's not what it is."
Be patient and allow your test to collect enough data. Even if you hit your sample size early, the final results might surprise you. And remember, tests that don’t achieve statistical significance can still provide valuable insights for improving future experiments.
Analyzing Results and Planning Next Steps
Once you've reached statistical significance, it's time to turn the data into actionable insights. Use these findings to guide ongoing improvements and refine your approach.
Read and Understand Test Results
Start by reviewing both primary and supporting metrics. To ensure reliable outcomes, each variant should have at least 1,000 visitors. Look for a p-value below 0.05, which indicates a 95% confidence level in your results.
Don’t overlook external factors like seasonality or special events that might influence user behavior. As CRO expert Michael Aargaard explains:
"You need to include enough visitors and run the test long enough to ensure that your data is representative of regular behavior across weekdays and business cycles. The most common pitfall is to use 95% confidence as a stopping rule. Confidence alone is no guarantee that you've collected a big enough sample of representative data. Sample size and business cycles are absolutely crucial in judging whether your test is cooked."
Segment your data to uncover patterns. For example, compare mobile versus desktop users, paid versus organic traffic, or new versus returning visitors. These breakdowns often reveal trends that can shape future experiments.
Balance quantitative data, like conversion rates, with qualitative user feedback. If a variant performs statistically better but garners negative feedback, dig deeper before implementing changes.
Record Findings and Make Changes
After analyzing the data, document your findings thoroughly to build a foundation for future tests.
Keep a detailed record of your experiments. Include essential information - such as hypotheses, dates, metrics, and insights - in a centralized system for easy reference. A well-organized repository allows you to track patterns and avoid repeating past mistakes.
Key elements to document include:
- Hypotheses and rationale
- Descriptions and screenshots of variants
- Test start and end dates
- Sample sizes and confidence levels
- Results for primary and secondary metrics
- Insights and learnings
- Planned next steps or follow-up tests
Bryan Clayton, CEO of GreenPal, highlights the importance of learning from tests:
"It amazes me how many organizations conflate the value of A/B testing. They often fail to understand that the value of testing is to get not just a lift but more of learning."
Even failed tests are valuable. They reveal what doesn’t work, helping you refine future strategies. If a variant underperforms, your hypothesis was incorrect - but you’ve still gained insight into user behavior. On the other hand, if the new version outshines the control, use it as your new baseline and move on to testing other elements.
Compare Tested Elements
To understand what drove your results, evaluate the specific elements you tested. Here's a breakdown of how different landing page components have performed:
| Element Type | Key Insights |
|---|---|
| Headlines | Bukvybag increased orders by 45% with the headline "Stand out from the crowd with our fashion-forward and unique bags" |
| Call-to-Action Buttons | Going boosted trial starts by 104% by changing "Sign up for free" to "Trial for free" |
| Form Fields | InsightSquared (now Mediafly) achieved a 112% lift in conversions by removing optional form fields |
| Visual Elements | Wayfair saw a 47% increase in conversions by using lifestyle images of rugs in room settings |
| Social Proof | Best Buy found that products with reviews converted 15% better than those without |
Analyze why certain elements succeeded by reviewing user behavior and page metrics. For example, WorkZone increased form submissions by 34% by switching customer testimonial logos from color to black and white, achieving 99% statistical significance. Similarly, Orange added a time-based overlay on their mobile subscription page and saw a 106.29% boost in lead collection. These examples not only show what worked but also when and why.
Extend these insights across your marketing channels. Landing page strategies that perform well can often be adapted for email campaigns, social ads, and other platforms. Incorporate these findings into your ongoing testing cycle to keep improving user experiences and conversion rates.
Key Takeaways for A/B Testing Success
Once you've nailed the setup and execution phases, it's time to focus on what really makes A/B testing work for the long haul. Here are the essentials for turning your efforts into consistent wins.
A/B testing takes the guesswork out of landing page optimization, transforming them into data-driven conversion tools. But it’s not just about finding a winning version - it’s about digging into user behavior and creating experiences that connect with your audience on a deeper level.
Start with a solid, data-backed plan. A successful test begins with a clear roadmap. Define measurable goals and craft a hypothesis rooted in reliable data. Fun fact: around 75% of visitors judge a website's credibility based on its design, so your testing strategy has to make a strong first impression.
Focus on what matters most. Zero in on high-impact elements that can drive noticeable improvements in conversions quickly.
Let the data do the talking. Patience is key when it comes to achieving statistical significance. CRO expert Michael Aargaard points out that confidence isn’t enough - you need enough data to back it up. Make sure your test runs long enough to capture user behavior across different days and conditions.
Test one variable at a time. To really understand what’s driving those conversion changes, isolate variables. For example, Wayfair saw a 47% boost in conversions by switching to lifestyle images, while Best Buy increased conversions by 15% by adding customer reviews.
Keep detailed records. Document everything - both wins and failures. This helps you build a playbook of what works and avoid repeating past mistakes. Over time, this knowledge base becomes a powerful resource for more effective testing.
Remember, optimization is never a one-and-done deal. Users expect seamless experiences, so continuous testing and tweaking are essential. This not only improves conversion rates but also reduces acquisition costs.
For extra help, tools like Reform can make form optimization and testing easier. They provide better user experiences and give you detailed performance insights, which can take your A/B testing results to the next level.
Use these principles to refine your approach and keep driving measurable improvements. A/B testing isn’t just a tactic - it’s a long-term strategy for growth.
FAQs
What should I test first when running an A/B test on my landing page?
When optimizing for better conversions, begin with the most visible and interactive elements on your page. Focus on your headline, call-to-action (CTA) buttons, and main images - these are the first things visitors notice and engage with.
Tuning these elements can have an immediate and noticeable impact on how users behave and the choices they make. By starting here, you’ll quickly pinpoint adjustments that lead to stronger engagement and higher conversion rates.
What are the most common mistakes to avoid during A/B testing for landing pages?
When conducting A/B tests on landing pages, it's easy to fall into some common traps. Here are a few to watch out for:
- Testing too many variables at once: Stick to changing one element at a time - like the headline, call-to-action, or layout. This way, you'll know exactly which change is driving the results.
- Using too small a sample size: If your audience is too limited, your results might not be reliable. Make sure enough users participate to reach statistical significance.
- Stopping the test too soon: Patience is key. Cutting a test short before gathering enough data can lead to decisions based on incomplete information.
- Overlooking external influences: Factors like holidays, seasonal trends, or ongoing marketing campaigns can impact your test outcomes. Keep these in mind when analyzing results.
By steering clear of these mistakes, you’ll set yourself up for more reliable insights and better landing page performance.
How can I make sure my A/B test results are accurate and meaningful?
To get reliable and meaningful results from your A/B tests, it's crucial to aim for statistical significance and gather enough data. Typically, this means using a significance level of 0.05 and targeting a 95% confidence level to ensure your findings are trustworthy. Let your test run long enough to collect sufficient data, avoiding any rush to conclusions.
Another key step is calculating the right sample size before launching your test. This prevents your results from being skewed by random chance or errors caused by a small sample. By taking these measures, you can accurately determine if the changes to your landing page are making a real impact.
Related posts
Get new content delivered straight to your inbox

The Response
Updates on the Reform platform, insights on optimizing conversion rates, and tips to craft forms that convert.


Drive real results with form optimizations
Tested across hundreds of experiments, our strategies deliver a 215% lift in qualified leads for B2B and SaaS companies.
