
.webp)
How to Measure AI Lead Scoring Effectiveness


AI lead scoring can boost conversion rates by 25% and reduce costs per lead by 15% compared to traditional methods, but success depends on tracking its performance. Start by qualifying leads effectively to set a baseline with metrics like conversion rates, lead response times, and lead-to-opportunity ratios. Then, evaluate your AI model using key indicators such as conversion rates by score, accuracy, and revenue per lead. Regularly review and refine your model to ensure it aligns with market shifts and delivers actionable results. Without consistent measurement, even advanced systems risk underperforming.
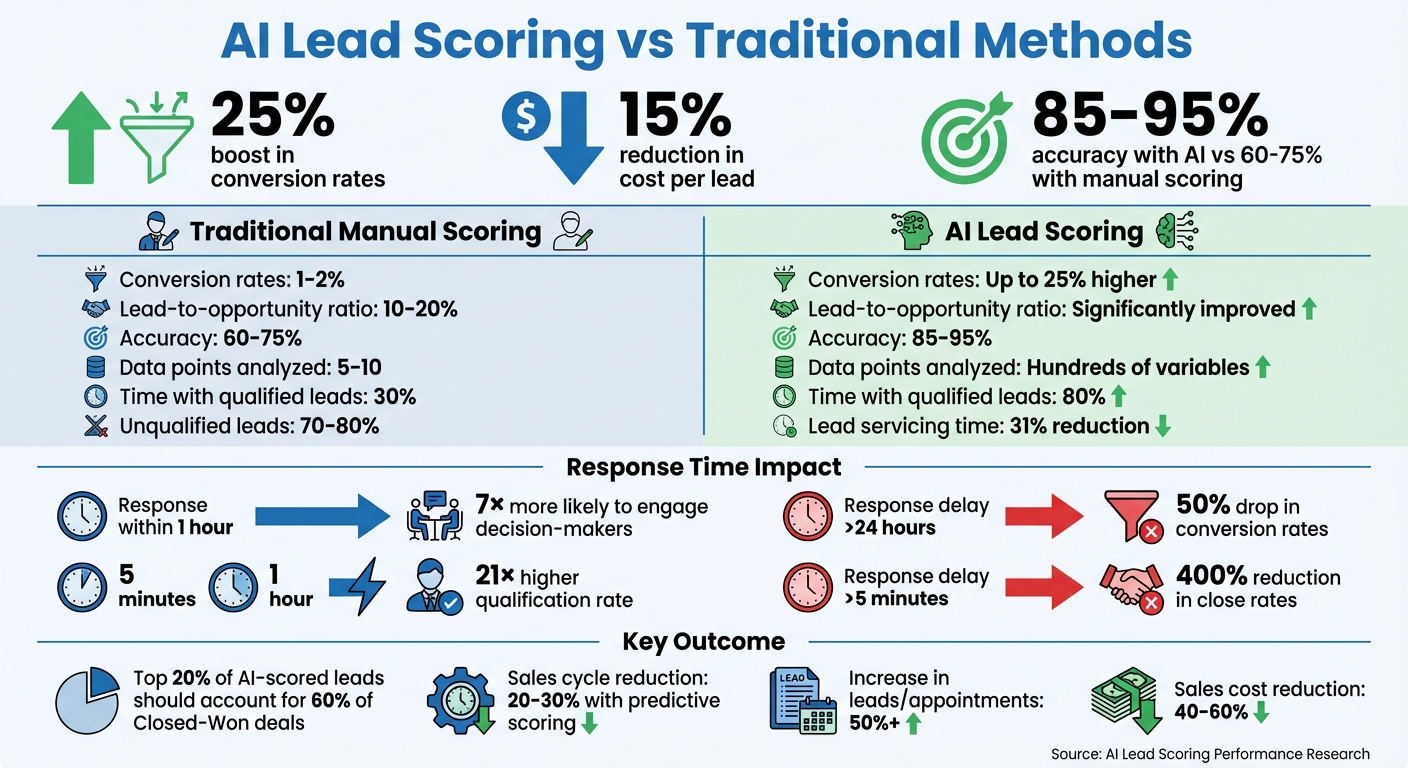
AI Lead Scoring vs Traditional Methods: Key Performance Metrics Comparison
Create a Baseline for Your Current Lead Process
Before diving into AI-driven improvements, it's crucial to document your current lead process. This gives you a solid reference point to measure how AI impacts key metrics like conversion rates, response times, and revenue per lead. Without this baseline, you're essentially working blind, unable to track meaningful progress.
Record Current Metrics
Start by pulling CRM data from the last 6–12 months to establish benchmarks. Focus on three core metrics:
- Conversion rates: The percentage of leads that turn into paying customers.
- Lead response times: The average time between capturing a lead and making the first contact.
- Lead-to-opportunity ratios: The percentage of leads advancing to sales-qualified opportunities.
For context, businesses without AI typically see conversion rates of 1–2% and lead-to-opportunity ratios around 10–20%. It's also worth noting that response times longer than five minutes can slash close rates by up to 400%.
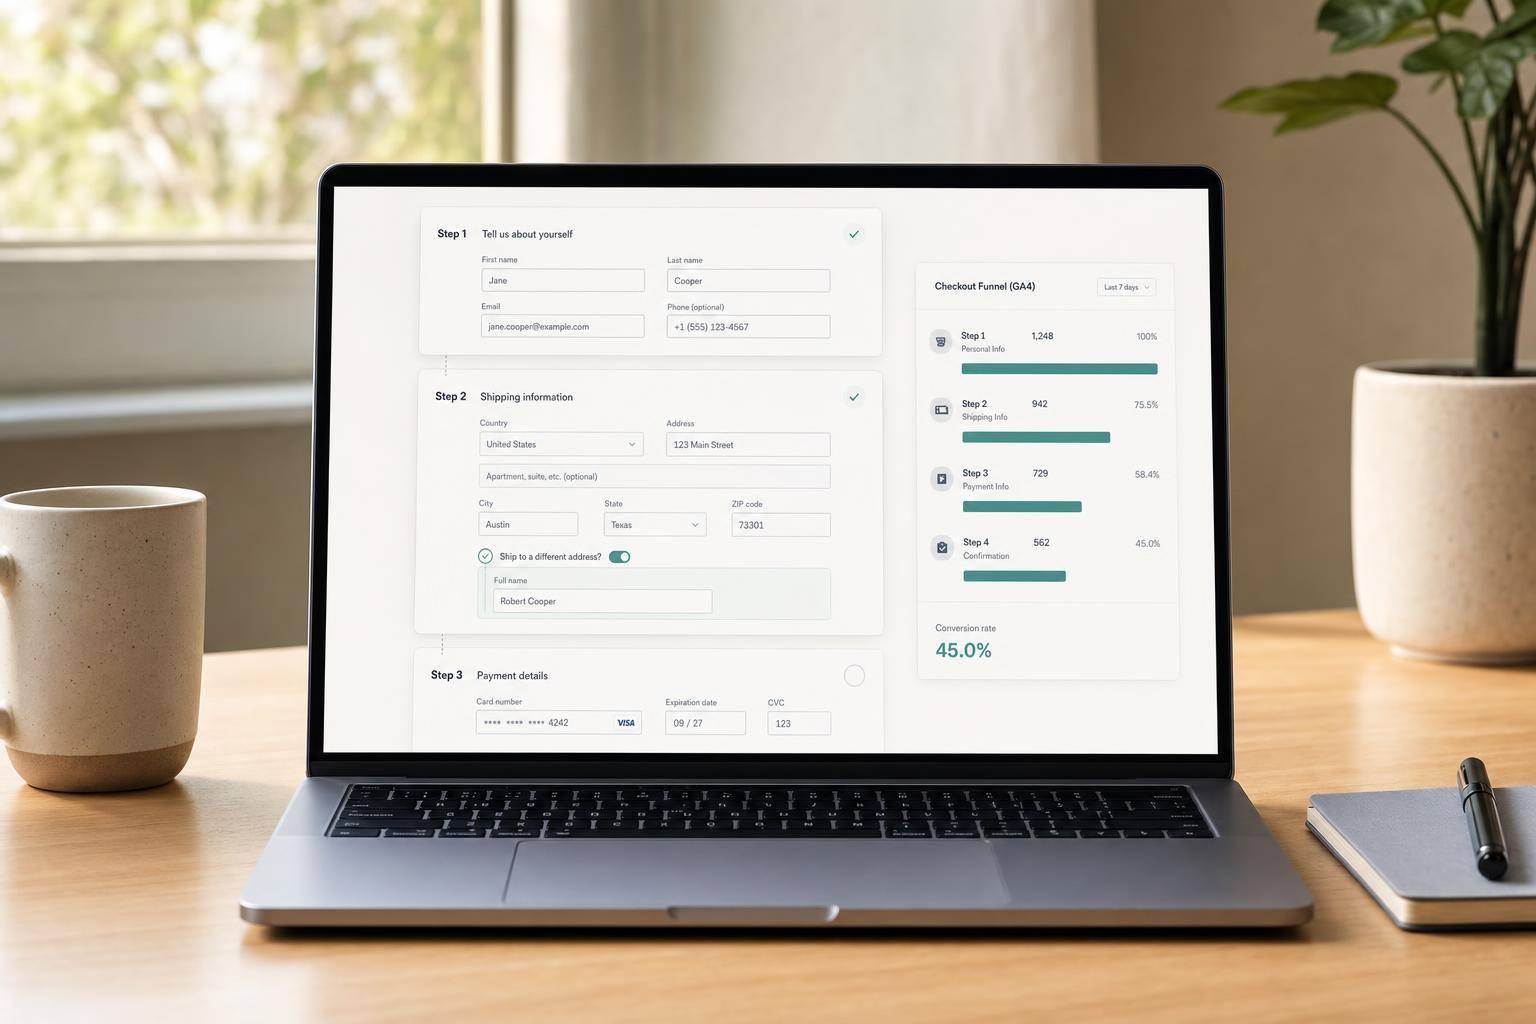
Segment your data by lead source - whether it's website forms, paid ads, or referrals - to identify your most effective channels. Pay attention to prospect intent and behavioral signals like email open rates, website visits, and content downloads, alongside firmographic details like company size and industry. For instance, leads with five or more website visits often convert at double the rate of those with fewer interactions. Use tools like Reform’s no-code form builder to streamline data collection and integrate it directly with your CRM. When documenting, calculate averages for metrics like lead volume, revenue per lead (in dollars), and sales cycle length (in days), using US date formatting (MM/DD/YYYY).
Find Gaps and Opportunities
Once you've gathered your data, dig into it to identify inefficiencies and areas for improvement. Look for patterns that stand out. For example, if 70–80% of your leads are unqualified, your sales team is likely spending too much time chasing low-potential prospects. Similarly, if your "hot" leads - those manually prioritized - are closing at only 5%, it may signal flaws in your current prioritization methods. Research also shows that response delays of more than 24 hours can cut conversion rates by 50%.
Pay close attention to mismatches between lead scores and revenue outcomes. Manual lead scoring often hits just 60–75% accuracy, relying on only 5–10 data points and inconsistent application across teams. In comparison, AI models can analyze hundreds of variables with 85–95% accuracy. Document these gaps in a spreadsheet or dashboard, tracking metrics like cost per acquisition and average deal size. This approach not only highlights inefficiencies but also lays the groundwork for AI-driven improvements, helping you focus on the metrics that matter most. These insights serve as a guide for refining your lead scoring process with AI.
sbb-itb-5f36581
Key Metrics to Measure AI Lead Scoring Performance
Once you've established a baseline, it's time to dive into the metrics that reveal how well your AI lead scoring system is working. The goal isn't perfection - it's about making smarter decisions at scale: deciding who to contact, how quickly to follow up, and which leads to prioritize for immediate action versus longer-term nurturing.
Conversion Rate by Lead Score
One of the clearest ways to validate your AI model is by examining conversion rates across different lead score tiers. Ideally, the top-scoring leads should convert at much higher rates. A strong model demonstrates a "monotonic lift", where conversion rates steadily improve as scores increase. For example, the top 20% of leads should account for around 60% of your Closed-Won deals. If "hot" leads aren't converting significantly better than "medium" ones, your model may need tweaking. To track this, break scores into bands (e.g., 0–25, 26–50, 51–75, 76–100) and compare their 60-day conversion rates. Then, use a confusion matrix to evaluate prediction accuracy.
Lead Scoring Accuracy
A confusion matrix is a powerful tool for assessing your model's accuracy. It categorizes leads into four groups:
- True Positives: Leads predicted to convert that actually did.
- True Negatives: Non-converters correctly identified as such.
- False Positives: Leads scored high but didn't convert.
- False Negatives: Missed opportunities - leads that should have been flagged but weren't.
To calculate overall accuracy, use this formula:
(True Positives + True Negatives) ÷ Total Leads Scored × 100.
Beyond accuracy, focus on recall - how often your model correctly identifies actual converters. Low recall suggests missed opportunities, which can hurt your sales pipeline. Accurate scoring ensures your high-priority leads align with actual conversions, keeping your strategy on track.
Lead Response Time
Speed matters. Companies that respond to leads within one hour are 7× more likely to engage decision-makers. AI can help by routing high-priority leads to sales reps almost instantly. Keep an eye on the average time between lead capture and first contact, often optimized through multi-step form design, and break this down by score tier. AI systems can cut lead servicing times by up to 31%. Check whether your fastest response times align with your top-scoring leads; if not, you may need to adjust your routing process.
Revenue Per Lead
This metric evaluates the financial impact of your lead scoring efforts. Measure the revenue generated from each score tier over a 90-day period. Calculate the average deal size for high (76–100), medium (51–75), and low (0–50) scoring leads. If your high-scoring leads aren't delivering proportionally higher revenue, your model might be prioritizing the wrong attributes. This analysis can reveal which segments give you the best return on investment and guide resource allocation.
Sales teams using effective AI lead scoring report spending up to 80% of their time with qualified leads, compared to just 30% with manual methods. Together, these metrics give you a clear picture of both operational efficiency and revenue outcomes.
Advanced Metrics for Deeper Analysis
After you've established your core metrics, you can take a closer look at advanced measurements to better understand how your AI model balances quality and coverage. These metrics help ensure your lead scoring system delivers outcomes that matter to your business.
Precision and Recall
Precision and recall are essential for evaluating how well your AI identifies high-quality leads without overwhelming your sales team. Recall measures the percentage of actual converting leads your model captures. It's calculated as the number of true positives divided by the sum of true positives and false negatives, multiplied by 100. For example, if your model identifies 650 out of 700 converting leads, your recall rate is 92%. On the other hand, precision ensures that the leads flagged as "hot" are genuinely likely to convert.
The F1 Score combines precision and recall into a single metric, which is especially helpful when working with unbalanced datasets. To fine-tune performance, adjust the qualification threshold and conduct holdout tests on 10–20% of leads using FIFO (First In, First Out). Define success outcomes, such as "Sales Accepted Lead" or "Opportunity Created", within a 60-day window.
Pipeline Velocity
Pipeline velocity tracks how quickly leads transition from initial contact to deal closure. By measuring the time from when a lead reaches its score threshold to when it becomes an opportunity, you can determine if AI-identified leads are moving through the pipeline faster. For instance, some companies have reported that integrating predictive scoring with real-time enrichment, routing, and service-level agreements shortened sales cycles by 20–30%.
Aggressive AI use has also been shown to increase leads and appointments by over 50% while cutting sales costs by 40–60%. To enhance pipeline velocity, consider adding velocity modifiers to your model. For example, trigger immediate alerts when multiple high-intent actions - like three visits to the pricing page - occur within 48 hours. Acting quickly is crucial; responding to leads within five minutes instead of an hour increases qualification rates by 21 times. To keep your models effective, retrain them every 10–30 days to avoid model drift and ensure they reflect current market conditions.
Sales Team Efficiency
Sales team efficiency metrics help you determine if your AI's statistical performance translates into real revenue. Lead rejection rates for high-priority leads are a key indicator; elevated rejection rates could signal that weak signals (e.g., multiple email opens) are inflating scores. SLA (Service Level Agreement) adherence, or speed-to-lead, can reveal whether your sales team trusts the AI's prioritization. Low adherence might indicate that score thresholds need adjustment.
Another useful metric is comparing conversion rates across score tiers. If lower-tier leads are converting at a higher rate than top-tier leads, your model may be undervaluing certain high-intent signals. Additionally, tracking the meeting-to-opportunity rate can help distinguish casual interest from genuine buying intent.
To align your scoring system with your team's capacity, recalibrate thresholds to ensure the "hot" lead volume is manageable. You can also apply time decay - such as reducing scores by 50% if no action is taken within 30 days - to prevent leads from stagnating.
Build a Measurement Framework
Once you know which metrics matter most, the next step is creating a structured system to track them consistently. Without a centralized framework, it's easy for data to become scattered, making it harder to spot trends or take timely action. A solid framework connects your baseline data with AI performance insights, helping you improve continuously.
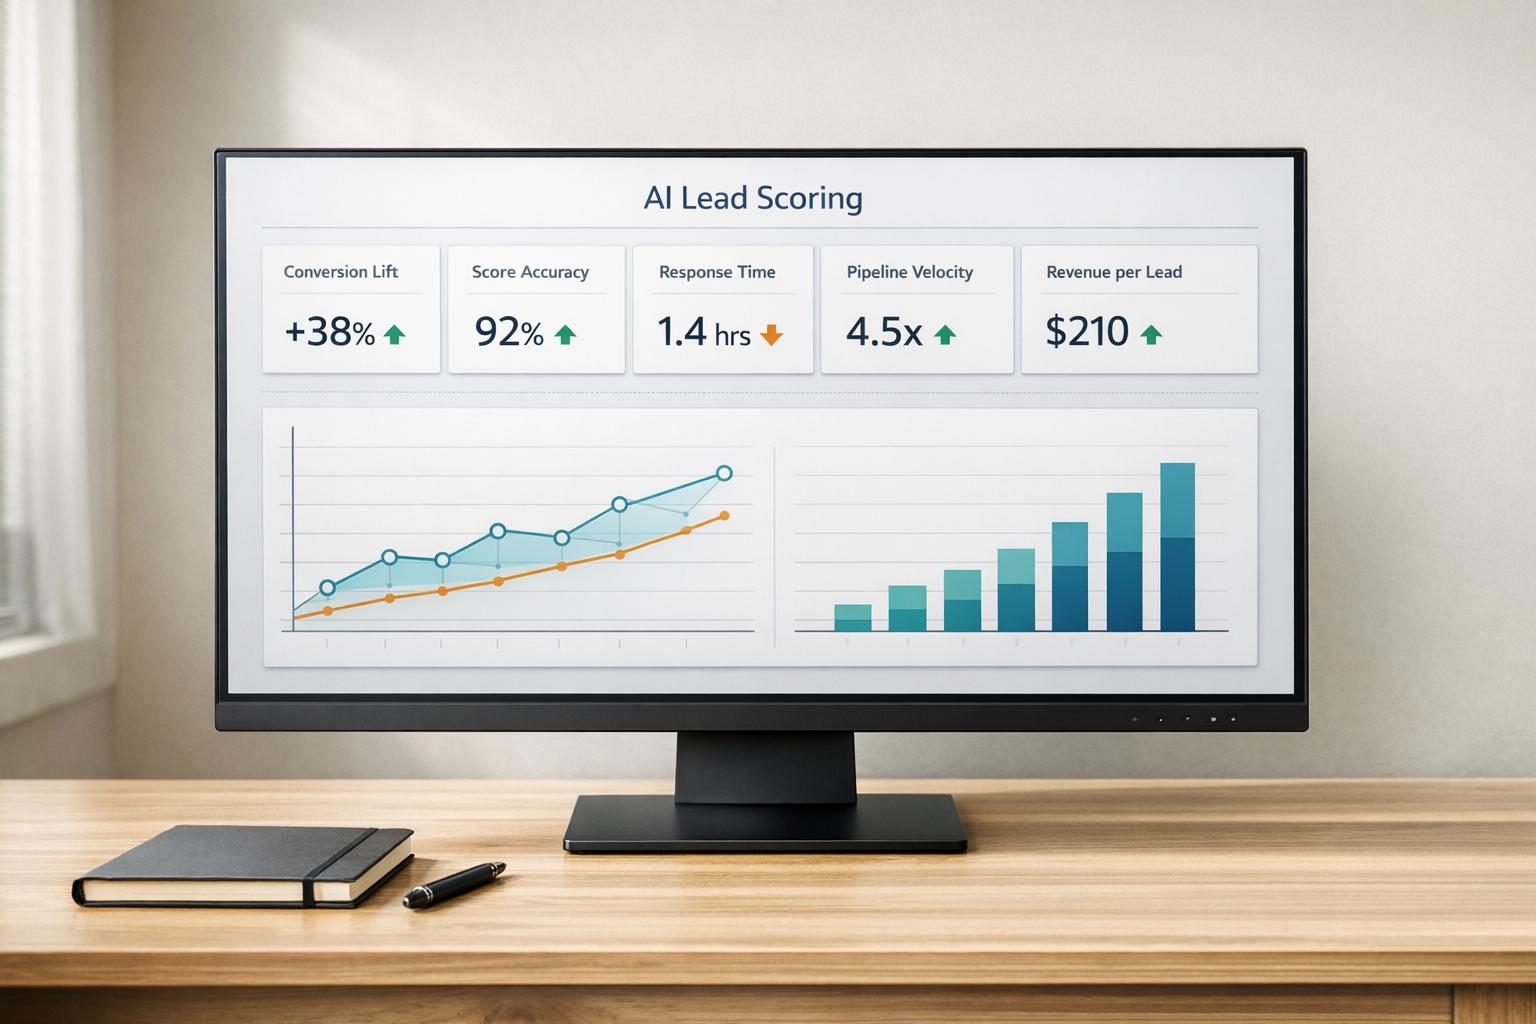
Create a Dashboard
A centralized dashboard pulls all your AI lead scoring metrics into one place, so you don’t have to juggle multiple tools. Many CRMs integrate directly with AI lead scoring data, making it easy to visualize key metrics like conversion lift and model accuracy. Tools like Google Analytics, Tableau, or Power BI can also provide custom visualizations for behavioral and firmographic data.
Here’s what your dashboard should cover:
- Conversion rate by lead score
- Lead scoring accuracy
- Pipeline velocity
- Sales team efficiency metrics, such as calls-to-meeting ratios
- Precision and recall
- Revenue per lead
- Lead response time
These metrics, which we’ve already discussed, come together in one view to give you a complete picture. Use line charts to track trends over time, bar graphs to compare score bands, and real-time gauges for quick insights. For instance, you might analyze how leads scoring 90+ correlate with $50,000+ average contract values compared to lower-scoring leads averaging $10,000.
Tools like Reform can further enhance your dashboard. It offers real-time analytics for form interactions, tracks multi-step form completion rates, and provides conditional routing data. Its lead enrichment features automatically append firmographic data to lead scores. Plus, Reform integrates with CRMs like HubSpot using APIs or Zapier, enabling you to monitor metrics like email validation success and spam prevention’s impact on lead quality. This creates a unified view, showing how high-scoring form leads convert alongside other AI-driven metrics.
Set a Review Schedule
Regular reviews are essential to keep your AI model aligned with shifting buyer behaviors and to avoid accuracy drifts. Establish a schedule like this:
- Weekly: Check your dashboard every Friday for changes in conversion rates and analyze trends in top and bottom score bands.
- Bi-weekly: Dive into precision, recall, and lead response time.
- Monthly: Assess revenue per lead and sales team efficiency metrics. For example, see if you’ve reduced your sales cycle length by 20–30%, as some companies have reported.
- Quarterly: Conduct a comprehensive audit. Include A/B tests to compare AI performance against your baseline and incorporate new data, like intent signals, to maintain the 60% accuracy boost over manual scoring.
This consistent cadence prevents issues from snowballing. You can also set automated alerts for critical thresholds - like conversion rates dropping below 20% - to act quickly. With a solid review schedule in place, you’ll be ready to adapt and fine-tune your AI model for the best results.
Optimize and Improve Your AI Model
Refining your AI model is not a "set it and forget it" task. It's an ongoing process that ensures your lead scoring adapts to evolving buyer behaviors and market dynamics. As The Pedowitz Group explains, "The goal isn't a perfect score - it's a score that reliably drives better decisions at scale: who to route, how fast to follow up, what motion to run, and when to nurture instead of pushing to sales".
Analyze Patterns in Incorrect Predictions
To improve your AI model, begin by identifying where it falters. Look closely at false positives (leads with high scores that didn’t convert) and false negatives (leads with low scores that did convert). These patterns can reveal specific weaknesses in your scoring logic. One effective approach is to create a calibration table that maps score bands to conversion rates over 30, 60, or 90 days. For instance, a score of 70 should ideally indicate a 70% likelihood of conversion.
Dig deeper by segmenting your data across key variables like product lines, regions, personas, and channels. This allows you to test how well your model predicts conversion and lift within these segments. Backtesting is another essential step - apply your scoring model to historical data to confirm that higher scores consistently correlate with better outcomes. If your top 20% of leads aren’t driving at least 60% of closed-won deals, your model might be overestimating lead quality. Once you pinpoint the errors, you can move forward with enriching your model.
Add New Data
For your AI model to remain effective, it needs a steady flow of updated and relevant data. Before retraining, ensure your data is clean and consistently defined - this includes lifecycle stages, timestamps, and source attribution. As The Pedowitz Group warns, "Garbage-in turns 'model error' into 'process error'".
If your Ideal Customer Profile (ICP) or product offerings have recently changed, consider narrowing your training window from two years to six months. This adjustment helps the model focus on more recent, higher-quality data. Evaluate the attributes your model uses - remove fields with large gaps in data and introduce "intelligent fields" that highlight key scoring factors. Use an 80/20 split for retraining, where 80% of historical data is used for training and the latest 20% is reserved for validation.
To maintain alignment across teams, set up a monthly scoring council with RevOps and Sales/Marketing leaders. This group can review a backlog of potential model adjustments and decide which new data signals - like engagement metrics or intent data - should be incorporated.
Test Changes and Track Results
After integrating new data and addressing errors, roll out updates cautiously. Start by applying changes to a small portion of your lead flow - typically 10–20% - so you can compare the updated model’s performance against your baseline. This baseline could be your previous scoring system or even FIFO (First In, First Out) routing. Measure the impact on pipeline growth and win rates to ensure the changes are effective.
Post-implementation, update your calibration tables to reflect how score bands align with actual outcomes. Conduct lift and conversion analyses across different segments to quickly spot any performance issues. Regular drift monitoring - on a weekly or monthly basis - can also help you catch shifts in lead volume or conversion rates early.
Finally, remember that even a well-performing model can fail if its outputs aren't used effectively. As The Pedowitz Group notes, "A model can test well and still fail if the workflow doesn't turn the score into consistent action". Monitor how closely sales teams follow AI-driven routing rules and adjust your retraining schedule based on market conditions - typically every three to six months.
Conclusion
Wrapping up your AI lead scoring measurement process means focusing on structure, tracking, and continuous improvement. Start by establishing a baseline - record your current conversion rates, lead response times, and revenue per lead. These benchmarks help you measure the impact of your AI model and prove its ROI.
After launching your model, focus on the metrics that matter most. Keep an eye on conversion rates by lead score, accuracy, pipeline velocity, and sales team efficiency. Use calibration tables to verify score accuracy and monitor for shifts in conversion tiers or lead volume that could signal model drift. As The Pedowitz Group puts it, "The goal isn't a perfect score - it's a score that reliably drives better decisions at scale: who to route, how fast to follow up, what motion to run, and when to nurture".
Continuous improvement is key. Dive into false positives and false negatives to uncover gaps in your scoring logic. When your ideal customer profile (ICP) evolves or your product offerings expand, bring in new data sources. Test updates on smaller segments before rolling them out fully, and use performance data to refine your approach. Regular reviews with RevOps and Sales leaders help ensure the model stays aligned with business goals.
Keep in mind, even the most accurate model won't deliver results if it doesn't drive action. Monitor SLA compliance to ensure top-tier leads get timely follow-ups. Validate that the top 20% of scored leads are contributing at least 60% of closed-won deals. If they aren't, it might be time to recalibrate your thresholds or tighten workflows.
FAQs
How long should I measure before judging the AI lead scoring model?
Evaluating your AI lead scoring model requires a timeframe that allows for meaningful data collection and analysis. A period of 3 to 6 months is generally recommended. This duration provides enough data to measure key metrics such as lift, conversion rates, and accuracy effectively. It also offers the opportunity to assess performance indicators like precision, recall, and ROC-AUC, ensuring you can make well-informed adjustments to optimize results.
What score threshold qualifies a lead as 'hot' for sales?
Leads scoring 90 or higher are typically labeled as "hot", indicating a strong potential for conversion. These leads often correspond to substantial deal opportunities, such as annual contract values (ACV) of $50,000 or more.
How do I spot and fix lead-scoring model drift?
To keep your lead-scoring model performing well, it’s essential to regularly monitor key metrics like lift, ROC-AUC, precision, recall, and calibration. These metrics help you spot any misalignment between predictions and actual outcomes, which could signal that the model is drifting.
If you notice drift, take action by validating the model's accuracy with updated data. You might need to retrain the model using fresh inputs or adjust thresholds to better reflect current realities. Consistently tracking performance ensures the model stays in sync with evolving customer behavior and market dynamics.
Related Blog Posts
Get new content delivered straight to your inbox

The Response
Updates on the Reform platform, insights on optimizing conversion rates, and tips to craft forms that convert.


Drive real results with form optimizations
Tested across hundreds of experiments, our strategies deliver a 215% lift in qualified leads for B2B and SaaS companies.
