
.webp)
Best Metrics For Real-Time Form Segmentation



If I had to track only a few form metrics live, I’d watch step drop-off, field errors, route split, lead score, invalid email rate, spam flags, and submit rate by segment. Those numbers tell me where people quit, which path they take, and whether the leads are worth sending to sales.
Here’s the short version:
- Step metrics show where the funnel leaks
- Field metrics show which question slows people down
- Route split shows how users move through conditional paths
- Lead score, invalid emails, and spam flags show lead quality during the session
- Submit rate by device, source, route, and score band shows which segments finish and qualify
A few numbers in the article stand out right away:
- Mobile submit rate: 12%
- Desktop submit rate: 28%
- Paid Search qualification rate: 30%
- Organic Social qualification rate: 10%
- High-Fit submit rate: 45%
- Low-Fit submit rate: 5%
- Fake, disposable, or invalid emails in free trials: 15%–30%
- Average daily spam submissions on unprotected forms: 15–20
I’d read the article as a simple system:
- Find where users stop
- Find which field caused it
- Check which route they entered
- Score the lead while the form is in progress
- Filter bad emails and spam
- Judge success by qualified submits, not just total submits
Here’s a quick comparison of the metric groups the article covers:
| Metric group | What I learn | Main action |
|---|---|---|
| Step progress | Where users start, move, and leave | Fix weak steps and drop-off points |
| Field friction | Which inputs cause stalls or errors | Simplify labels, formats, and validation |
| Route split | How conditional paths perform | Adjust routing and qualification logic |
| Lead quality | Which leads look strong or risky | Send, nurture, or filter leads |
| Submit rate by segment | Which audiences finish and qualify | Shift effort to higher-quality segments |
The core idea is simple: live form segmentation is not just about getting more submissions. It’s about seeing who is filling out the form, where they struggle, and whether they should go to sales, nurture, or be blocked.
Step Completion Metrics That Show Funnel Progress
Real-time segmentation starts with four metrics: form start rate, completion rate, step completion rate, and step drop-off rate.
Form Start Rate, Completion Rate, and Step Drop-Off
Form start rate shows how many people who see the form actually begin it. To calculate it, divide the number of sessions where step 1 is started by the total sessions where the form was viewed, then multiply by 100. If this rate is low, the issue often shows up before the form even begins: weak copy, poor placement, or a form that looks too long at first glance.
Overall completion rate measures how many people who start the form go on to submit it. Divide successful submissions by total form starts. If start rate is decent but completion rate drops, that usually means people are interested, but something in the experience is slowing them down or pushing them away.
Then look at step completion rate and step drop-off rate to find the leak. For each step, divide the number of users who complete it by the number who started it. When one step shows a sharp drop, that's usually where friction lives. Maybe the instructions are unclear. Maybe you're asking a sensitive question too soon. Maybe validation rules are too strict.
Track all four metrics in the same time window, and segment them by source, device, and audience. That way, you're not looking at one blended average that hides the problem.
Use these rates to group users by how far they get.
Segmenting Users by Last Completed Step
Most abandoners fall into three groups:
- Early abandoners complete only the first step or two before leaving. This usually signals low intent, weak traffic fit, or friction right at the start.
- Mid-funnel abandoners often run into qualification fields, budget questions, or too many required fields.
- Near-completers reach the final step, or the one right before it, but don't submit. These people usually have strong intent. They're often blocked by something small, like a validation error, unclear consent language, or a technical hiccup.
These groups don't behave the same way, and they don't carry the same recovery value:
| Segment | Steps Completed | Time to Drop-Off | Lead Quality |
|---|---|---|---|
| Early abandoners | 1–2 | 5–20 seconds | Low - low fit, low intent; some can be warmed via broad nurture campaigns |
| Mid-funnel abandoners | 2–3 | 30–90 seconds | Medium - reasonable fit and interest; respond well to targeted follow-up and remarketing |
| Near-completers | 4–5 | 90–180+ seconds | High - strong intent; high re-engagement value |
Near-completers are the highest-value recovery segment.
Field Friction and Route Split Metrics
After step-level drop-off, zoom in on the exact field that makes people quit. Step-level data tells you which step users leave on. Field-level data shows which question caused the stall.
Field Drop-Off and Validation Friction
The four field-level metrics that matter most are field drop-off rate, field error rate, hesitation time, and correction loops. Field drop-off rate is the share of users who start a field and then leave before submitting. Field error rate tracks how often a field triggers a validation error. Hesitation time measures the gap between focus and first input. When that gap gets longer, confusion is usually the reason. Repeated edits often point to an unclear label or format.
Budget, company size, and open-text qualification fields tend to create the most friction. A simple fix can go a long way here: use ranges, clearer labels, and examples.
These signals can help you shorten the path, add inline help, or flag risky leads in real time. If someone hesitates on a budget field, triggers several validation errors, or keeps editing the same field, that user can be marked as a high-friction segment. From there, you can send them to a shorter path or tag them in the CRM so sales reps know to adjust their approach.
Route Split by Conditional Path
When conditional logic sends users down different paths, each route becomes its own mini-funnel and its own lead segment. Route split shows how users spread across those paths, but the metric gets much more useful when you pair it with completion rate, drop-off hotspots, average lead score, and downstream conversion for each route.
Track each path across those four dimensions at the same time. A high-volume route with strong completion but low lead scores and weak downstream conversion points to a qualification gap. On the flip side, a low-volume route with high friction but strong conversion points to drop-off you may be able to cut without weakening qualification.
That’s the heart of it: find the exact fields causing avoidable abandonment on each path, then simplify those fields without watering down the route’s qualification value.
Once route performance is clear, compare lead score changes and spam signals by path.
sbb-itb-5f36581
Lead Quality Metrics: Score Changes, Invalid Emails, and Spam Flags
Once the route split is clear, the next step is to track lead quality as it happens. Three signals do most of the heavy lifting: lead score changes during the session, invalid email rate, and spam flag rate. Put them together, and you can spot high-priority leads fast while filtering out risky or low-value submissions before they ever hit your CRM.
Lead Score Changes During the Form Session
Real-time scoring adds points to answers as people move through the form. That gives you a live read on fit instead of making you wait until the end.
Use three score bands:
- High-Fit (80+)
- Medium-Fit (40–79)
- Low-Fit (below 40)
Each band should trigger a different path. High-Fit leads can go straight to sales. Medium-Fit leads can enter nurture. Low-Fit leads can move to a shorter self-serve flow. When the form is submitted, the updated score should pass to your CRM.
Invalid Email Rate and Spam Flag Rate
Invalid email rate is the share of submissions that fail syntax, domain, or deliverability checks. A SaaS-focused analysis reports that 15–30% of free trial signups use fake, disposable, or invalid email addresses.
Score tells you fit. Email and spam checks tell you whether the submission itself looks clean.
Spam flag rate measures the share of submissions that show suspicious behavior, like fast completions, repeated IPs, random names, or disposable domains. Without protection, the average contact form receives 15–20 spam submissions daily. Reform includes built-in spam prevention and can pass a spam_flag attribute with each submission, so flagged leads can be suppressed before they clog your pipeline.
These tiers make it easier to see who needs action now and who should be filtered or handled later:
| Segment | Avg. Lead Score | Invalid Email Rate | Spam Flag Rate | Downstream Indicator |
|---|---|---|---|---|
| High-Fit | 80–100 | < 1% | < 0.5% | 35–50% demo/meeting rate |
| Medium-Fit | 40–79 | 2–5% | 1–2% | 10–20% MQL-to-SQL conversion |
| Low-Fit / Risky | < 40 | > 10% | > 5% | < 5% email open/engagement rate |
These numbers tend to move together. Lower scores often come with higher invalid-email and spam rates. Next, compare submit rate by segment to see which audiences finish the form and which ones stall.
Submit Rate by Segment and How to Act on It
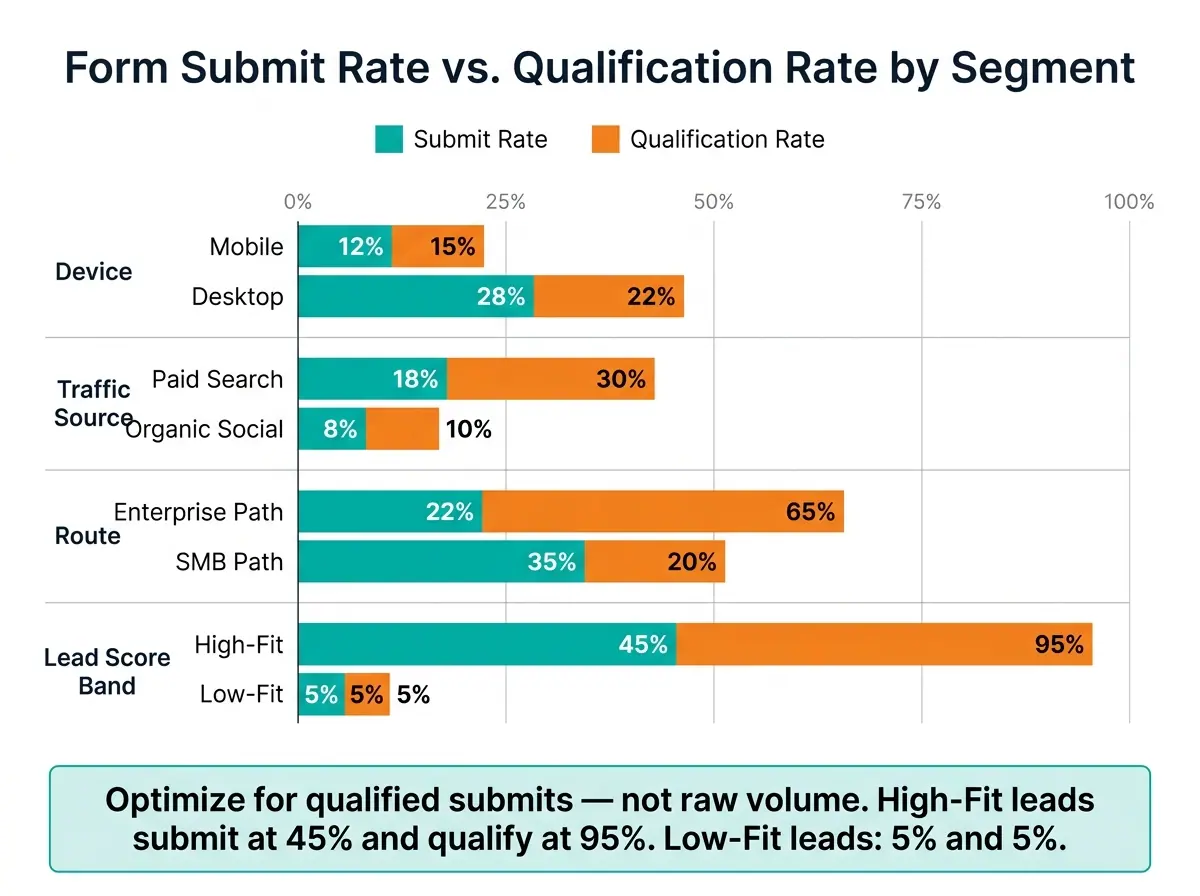
Form Segmentation Metrics: Submit Rate & Qualification Rate by Segment
After score and quality checks, submit rate tells you which segments actually make it to the end. And those gaps can be big enough to change how you route leads and how you follow up.
What matters most here isn’t raw form volume. It’s valid submissions that are worth sending to sales. When you break submit rate out by segment, you can see which audiences finish, qualify, and convert.
Submit Rate by Device, Source, Route, and Score Band
Use submit rate to compare segments side by side.
| Segment | Submit Rate | Qualification Rate |
|---|---|---|
| Device: Mobile | 12% | 15% |
| Device: Desktop | 28% | 22% |
| Source: Paid Search | 18% | 30% |
| Source: Organic Social | 8% | 10% |
| Route: Enterprise Path | 22% | 65% |
| Route: SMB Path | 35% | 20% |
| Score: High-Fit | 45% | 95% |
| Score: Low-Fit | 5% | 5% |
A quick read of this table tells you a lot.
Desktop users submit at 28%, while mobile users submit at 12%. That’s a strong sign that the mobile experience may need work. Maybe the form feels too long on a phone. Maybe one field is a pain to fill out on a small screen.
Source quality also stands out. Paid Search submits at 18% with a 30% qualification rate. Organic Social is at 8% and 10%. If one source brings in traffic that doesn’t finish or qualify, that’s not just a traffic problem. It’s a routing, targeting, or message-match problem.
The route split matters too. The Enterprise Path has a 22% submit rate but a 65% qualification rate. The SMB Path submits at 35% but qualifies at 20%. So yes, the SMB path gets more people through, but the Enterprise path brings in far more sales-ready leads. That changes how you judge performance.
Score bands make the pattern even clearer. High-Fit leads submit at 45% and qualify at 95%. Low-Fit leads are at 5% and 5%. That’s about as blunt as it gets.
Optimize for qualified submits, not raw submit volume. Start with the biggest gaps. That’s usually where you’ll find the best chances to simplify the form, adjust routing, or shift traffic to better-performing segments.
And timing matters. Act on segment shifts the same day. A paid search drop or a source-specific spam spike shouldn’t wait for a weekly recap.
Conclusion: The Metrics That Matter Most for Live Segmentation
Read step completion, field friction, route split, lead quality, and submit rate together to spot leaks and respond to live segment shifts.
That takes a few basics:
- Consistent event naming like
form_started,step_completed,route_assigned, andform_submitted - Clear segment definitions that your team documents and uses the same way
- Real-time reporting that shows drops before they pile up
In Reform, conditional routing, lead scoring, email validation, spam prevention, and real-time analytics work together. Integrations also help keep segment data aligned from form submission into your CRM.
These segment gaps should drive immediate fixes, not monthly reporting.
FAQs
Which form metrics should I track first?
Start with the five form fields that have the highest abandonment rates. When you track those drop-off points in real time, you can see exactly where people leave. That makes it much easier to fix weak field design and improve lead generation.
Then broaden the view with segmentation metrics like step completion, route splits, and lead score changes. Those signals help you tighten data quality and sharpen your conversion strategy.
How do I find the field causing drop-off?
Use field interaction metrics and form analytics to find where people leave your form. Check session data to spot the five fields with the highest drop-off rates.
That gives you a clear view of where the form is slowing people down. From there, you can improve those fields, cut friction, and help drive better lead generation results. Reform’s real-time analytics and multi-step forms can help you track behavior and see where leads exit.
Why optimize for qualified submits?
Optimizing for qualified submits helps close the gap between lead volume and sales results. It keeps your team focused on the prospects most likely to convert, instead of bogging them down with unqualified data.
And timing matters more than most teams think. Because 87% of buying signals happen within a 72-hour window, real-time capture and routing of high-intent leads can help protect conversion rates. Segmentation and scoring also keep your CRM cleaner and your outreach more focused.
Related Blog Posts
Get new content delivered straight to your inbox

The Response
Updates on the Reform platform, insights on optimizing conversion rates, and tips to craft forms that convert.



Drive real results with form optimizations
Tested across hundreds of experiments, our strategies deliver a 215% lift in qualified leads for B2B and SaaS companies.
