
.webp)
Compliance Dashboard Setup: Step-by-Step Guide


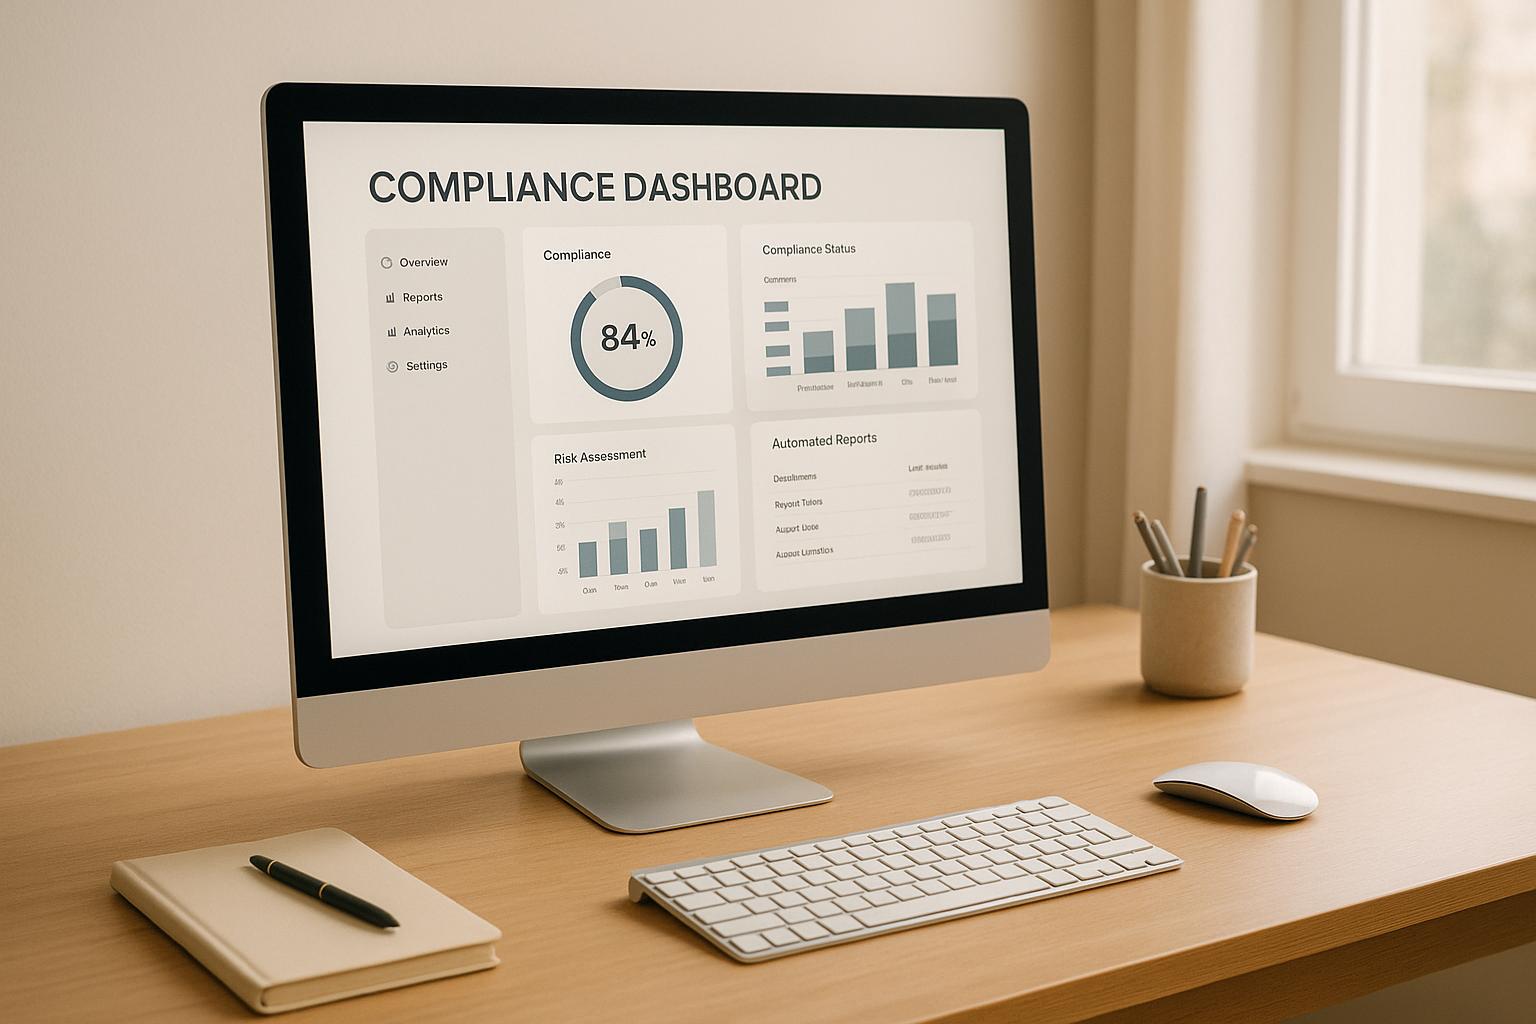
Managing compliance data doesn't have to be chaotic. A compliance dashboard simplifies everything by centralizing data, providing real-time insights, and automating reporting. Companies using dashboards save 30-40% of compliance reporting time and reduce regulatory risks by 50%. Here’s how it works:
- What it is: A visual tool that consolidates compliance metrics - like audit findings, training completion, and incident reports - into one interface.
- Why it matters: Provides real-time updates, faster decision-making, and smoother audits.
- Key steps to set up:
- Plan your metrics and goals.
- Integrate reliable data sources.
- Secure with role-based access and audit logs.
- Customize layouts for clarity and relevance.
- Automate alerts and reports for efficiency.
Bottom line: A well-designed compliance dashboard transforms compliance from a time-consuming burden into an organized, efficient process.
Compliance Dashboard in Excel
Planning Your Compliance Dashboard Setup
Jumping into dashboard creation without a clear plan can lead to big problems. You might end up tracking irrelevant metrics, missing critical data, or even exposing sensitive information to the wrong people. Skipping the planning phase often results in dashboards that are more of a liability than a useful tool.
The planning stage is where you decide if your dashboard will be a powerful compliance solution or just another system no one uses. This is why taking the time to plan thoroughly is so important before building your dashboard.
Choosing Key Compliance Metrics
Once you have a general plan, the next step is identifying the most important metrics to focus on. These metrics are the backbone of any effective compliance dashboard, so it’s crucial to choose ones that directly support compliance monitoring and decision-making.
Start by defining the goals of your compliance program. Are you aiming to improve audit readiness, manage risks, or keep up with regulatory requirements? Your goals will determine which metrics deserve a spot on your dashboard. For example, if audit readiness is your priority, you’ll want to track things like control testing completion rates, unresolved audit findings, and the status of evidence collection.
One essential metric to include is your overall compliance status. This can be represented as a compliance score that provides executives and stakeholders with a quick snapshot of your organization’s compliance health. Supporting this score are other metrics, like the number of controls tested, planned, or still pending.
Operational metrics are equally important - they give your team the insights needed for day-to-day decision-making. Focus on metrics that directly measure compliance performance and help identify patterns or issues before they escalate.
Don’t overlook compliance issues broken down by severity and status. A simple count of open issues isn’t very helpful, but a breakdown - such as 3 critical, 7 medium, and 5 low-priority issues, each with assigned owners and due dates - turns raw data into actionable insights.
It’s also smart to balance your metrics between leading indicators (predictive) and lagging indicators (historical). Leading indicators might include training completion rates or the number of policies being updated, while lagging indicators could track audit findings or past regulatory violations. Together, these provide both foresight and context.
Finding Data Sources and Tools
The quality of your compliance dashboard depends entirely on the data you feed into it. The challenge isn’t finding data - it’s ensuring the data is reliable, accurate, and complete, and that it integrates smoothly into your dashboard.
Start by auditing your existing systems. Compliance-related data is often scattered across various platforms - like GRC tools, HR systems for training records, financial software for transaction monitoring, and security tools for incident tracking. Catalog these systems, noting what data they provide and how often they update.
Next, validate each data source. Check the reliability and accuracy of the data by comparing information across systems. For example, if your HR system shows a 95% training completion rate but your learning management system shows 87%, you need to resolve the discrepancy before connecting either to your dashboard.
Integration capabilities are another critical factor. Look for systems with APIs or direct connectors to streamline data flow and eliminate silos. While manual data exports might work as a temporary solution, they quickly become impractical as your dashboard grows.
Pay attention to the data refresh frequency. Real-time monitoring requires sources that can update continuously, not just once a day or week. If a key system only updates monthly, you’ll need to account for that limitation in your dashboard design.
Finally, establish strong data governance practices. Assign ownership for each data source, define quality standards, and set up processes to address inaccuracies. Even the most sophisticated dashboard is useless if built on faulty data.
Once your data is verified and integrated, the next step is securing it and setting up access controls.
Setting Up Security and Access Controls
With your data in place, securing it becomes a top priority. Compliance data is often highly sensitive, so robust security measures are a must. A breach involving compliance data could lead to regulatory penalties, legal challenges, and reputational damage.
Start with user authentication. Require strong, multi-factor authentication for all dashboard users, and integrate this with your organization’s identity management system.
Next, assign role-based permissions to control who can access what. Different users will need different levels of access. For example, compliance team members might need full access to investigate and report, while others may only need read-only access to view reports.
Consider implementing multi-level permissions for added security. Some users might only need to view data, while others require the ability to update or configure the dashboard. Clearly define these permission levels and review them quarterly to ensure they remain accurate.
Audit logging is another critical feature. Keep a detailed log of who accesses the dashboard and what actions they take. This not only creates accountability but also helps identify potential security issues. Track all access, data exports, configuration changes, and user management activities.
Align your dashboard’s data protection measures with the sensitivity of the information it handles. If you’re dealing with personal or financial data, ensure your platform complies with relevant security certifications.
Regular access reviews are essential to maintaining security over time. Schedule quarterly reviews to update permissions, remove access for former employees, and adjust roles as needed. This ensures your dashboard remains secure as your organization evolves.
Lastly, consider data segmentation to protect sensitive information further. Not all compliance data requires the same level of security. By segmenting data and applying different access controls to each category, you can limit exposure while still ensuring usability for authorized users.
Customizing Your Compliance Dashboard
With security and access in place, it's time to transform your basic dashboard into a tool that turns raw metrics into actionable insights, helping you make quicker, smarter decisions.
The goal here isn’t just a sleek interface - it’s about creating a system that delivers information in a way that drives effective decision-making. And, of course, it should make it easy for everyone to access the data they need when they need it. Let’s dive into how to structure and customize your dashboard to meet these goals.
Creating the Dashboard Layout
An effective compliance dashboard starts with a well-thought-out layout. A clear structure not only looks good but also ensures users can quickly find the information they need.
Start by organizing your metrics into logical categories like audit readiness, risk management, and training compliance. Place the most critical metrics front and center for easy visibility.
Color coding is a game-changer for quick visual communication. Use green for compliance, yellow for areas that need attention, and red for critical violations or overdue tasks. This simple system helps users spot urgent issues at a glance without digging through detailed reports.
Choose your visualizations wisely - each type serves a purpose. For example:
- Line charts are great for showing trends over time.
- Progress bars work well for tracking completions, such as training or policy acknowledgments.
- Heatmaps can highlight risk areas across departments.
Avoid clutter by limiting the number of widgets on your main view. Focus on metrics that directly support decision-making and provide drill-down options for more detailed data.
Lastly, make sure filters and date selectors are intuitive and easy to use. These tools allow users to customize their view - whether by time period, department, or compliance area - without leaving the dashboard.
Building Department-Specific Views
Customizing dashboards for different departments ensures the information is relevant and actionable for each team. After all, compliance needs vary across roles.
For example:
- HR might focus on training completion rates and pending policy acknowledgments.
- Finance could benefit from tracking regulatory deadlines and audit findings.
- Operations might need insights into safety incident trends and equipment inspection schedules.
Tailoring dashboards in this way not only simplifies the user experience but also keeps data secure by showing teams only what’s relevant to their responsibilities. Include drill-down features so users can explore details when needed, and use role-based access controls to maintain confidentiality.
Adding Branding and Accessibility Features
Once your layout is set and departmental views are tailored, it’s time to focus on branding and accessibility. These elements ensure your dashboard aligns with your company’s identity and meets the needs of all users.
Incorporate your company’s branding throughout the dashboard. Use your organization’s color palette, logo, and typography consistently across widgets, headers, and buttons. This creates a professional, cohesive look that aligns with your other business tools.
Accessibility is just as important. Add high-contrast color schemes for users with visual impairments, ensure compatibility with screen readers, and include keyboard navigation options. Following WCAG guidelines not only helps meet legal requirements but also ensures a better experience for all users.
To go a step further, offer customization options like adjustable text sizes, alternative color schemes, and flexible layouts. These features make the dashboard more user-friendly and accommodate diverse needs.
For compliance data collection, consider using Reform. This no-code platform allows you to create branded, accessible forms that integrate seamlessly with your dashboard - no technical expertise required. It’s a simple way to maintain a cohesive look and feel across all compliance tools.
Investing in branding and accessibility isn’t just about aesthetics - it’s about driving adoption and improving overall compliance. A dashboard that looks polished and works well for everyone is a dashboard people will actually use.
sbb-itb-5f36581
Data Integration and Automation
After customizing your dashboard, the next step is connecting data sources and automating processes. By linking your dashboard to various systems and automating updates, you create a dynamic compliance monitoring tool. Automated data flows ensure your dashboard stays updated, reducing errors and addressing compliance gaps before they escalate.
Connecting Real-Time Data Sources
Integrating real-time data is essential for effective compliance monitoring. It allows you to connect tools like governance, risk, and compliance (GRC) platforms, HR systems, vendor management tools, audit management software, and security monitoring systems. Depending on the system's capabilities, you can integrate data through APIs, database connectors, or secure file uploads.
Start by mapping relevant data sources to capture critical information and develop a clear integration strategy. For instance, connecting your HR system via API can automate updates on training completion rates, while linking a security tool provides real-time alerts for incidents.
Use encrypted authentication methods, such as OAuth or encrypted SFTP, to secure these connections. Set up automated error notifications to quickly address integration issues, and validate incoming data to maintain accuracy.
In 2024, a U.S.-based healthcare provider integrated their compliance dashboard with HR, risk management, and audit systems using API connectors. This setup enabled real-time tracking of HIPAA training completion, incident reporting, and audit findings, leading to a 35% faster response to compliance incidents and a 22% boost in audit readiness scores.
Regular syncing, continuous monitoring, and automated reconciliation processes ensure your dashboard always reflects your current compliance status.
Setting Up Automated Alerts
Automated alerts transform your compliance dashboard into a proactive warning system. These alerts can notify you of compliance deadlines, policy expirations, incident reports, audit findings, and control failures. Customize alert thresholds based on roles - compliance officers might receive all alerts, while department heads get notifications relevant only to their areas.
Choose delivery methods that match the urgency of the issue: email for non-urgent updates, SMS for immediate concerns, and in-app alerts for users actively engaging with the dashboard.
Companies using real-time compliance dashboards report a 30% faster response time to incidents compared to those relying on manual or static reporting.
Review and adjust alert rules regularly to focus on the most critical triggers. These alerts form the foundation for more advanced reporting and analytics.
Using Reform for Compliance Forms
To simplify data collection, integrate compliance forms directly into your dashboard. Reform offers a no-code solution that allows you to create professional, branded forms without technical expertise. These forms feed real-time data into your dashboard, streamlining compliance tracking.
Reform's conditional routing feature enables you to design forms that adapt to user input, showing only relevant questions. Built-in email validation and spam prevention ensure the data collected is clean and reliable, which is crucial for accurate reporting and audit trails. Additionally, analytics provide insights into submission trends, helping you identify and address potential issues quickly.
Integration is straightforward using webhooks and APIs, which connect your forms to your dashboard or other platforms like CRMs and marketing automation tools. This eliminates manual data entry and reduces the chances of errors.
A U.S.-based healthcare provider used Reform to create HIPAA training acknowledgment forms tailored to different staff roles through conditional routing. These submissions were automatically validated and routed to the compliance dashboard via CRM integration. Real-time analytics allowed compliance officers to monitor completion rates and send automated reminders to overdue staff, cutting manual follow-ups by 30% and improving audit readiness.
To set up Reform, select a template, customize the fields, apply conditional routing, and connect the forms to your systems. Use analytics to refine your compliance data collection over time, ensuring an efficient and reliable process.
Configuring Reports and Analytics
Once you've integrated your data and automation tools, the next step is setting up reporting and analytics to turn raw data into meaningful insights. Here's how you can configure reports, audit trails, and export features to enhance your compliance dashboard.
Setting Up Report Features
Your compliance dashboard should be equipped to track key performance indicators (KPIs) and analyze trends effectively. Customizable KPIs are essential for monitoring metrics like incident counts, resolution times, control effectiveness, audit findings, and training completion rates.
Visual tools like line charts, bar charts, and heatmaps make it easier to identify patterns and trends, catering to both technical and non-technical audiences. For instance, a heatmap can quickly highlight areas of concern, while line charts can track improvements or recurring issues over time.
Drill-down capabilities add another layer of depth. If there's an increase in compliance incidents, users should be able to click through to see which departments are impacted, the types of incidents, and how they were resolved. These details help pinpoint problem areas and streamline corrective actions.
Color coding is another simple but powerful feature. Use green for compliant statuses, yellow for warnings, and red for critical issues. This visual hierarchy enables compliance officers to prioritize responses at a glance.
For executives, a compliance score that aggregates metrics like control effectiveness, test results, and unresolved issues provides a quick yet comprehensive snapshot. Grouping related metrics into categories - such as audit readiness, risk management, and training completion - further improves clarity and ensures that each stakeholder sees the most relevant data.
Creating Audit Trails and Historical Records
Maintaining audit trails and historical records is crucial for transparency and compliance. Automated logging should capture details like who performed an action, when it occurred, and what changes were made. This ensures full traceability, a key requirement for regulatory compliance.
Version control is equally important. Your system should save previous versions of policies, procedures, and control documents, complete with timestamps and user information. This creates a clear chain of custody, which auditors often rely on during reviews.
A healthcare organization successfully streamlined its compliance process by implementing a dashboard that tracked HIPAA training completion, incident response times, and audit findings. With automated alerts and exportable reports, they reduced audit preparation time by 40% and improved communication with internal teams and external auditors, leading to a successful audit outcome.
Exporting and Sharing Reports
Analyzing data is only part of the equation - sharing those insights effectively is just as important. Your dashboard should support multiple export formats to meet different needs. For example, PDFs are ideal for executive summaries and board presentations, while Excel files allow deeper analysis and custom visualizations. CSV files offer flexibility for importing data into other systems or conducting advanced analytics.
Automating report generation and distribution can save time and ensure consistent communication. For instance, set up weekly reports for department heads and monthly summaries for senior leadership. This reduces manual effort while keeping everyone informed.
Secure sharing methods - like encrypted emails or password-protected links - are essential for sensitive data. Customizable report templates can help departments focus on their specific metrics while maintaining a consistent look and feel.
Real-time report sharing is another valuable feature, especially for meetings or urgent situations. Stakeholder-specific dashboards that filter data based on user roles ensure that everyone - from board members to compliance officers - sees the information they need without unnecessary clutter.
Lastly, configure your system to log report access and sharing activities. Tracking who generated a report, when it was created, and who it was shared with adds an extra layer of accountability and reinforces compliance during audits.
Conclusion and Key Takeaways
A compliance dashboard transforms how organizations approach risk management, moving them from a reactive stance to a more proactive strategy. By following the steps outlined in this guide - from careful planning and customization to seamless data integration and reporting - you can establish a centralized, automated, and actionable compliance system.
The benefits of such a system are clear. Centralized dashboards can cut reporting time by up to 30% and enhance audit readiness by 25%, thanks to their ability to unify data from various sources and provide greater transparency. This streamlined approach empowers compliance teams to detect trends, identify risks, and confidently demonstrate regulatory adherence during audits - all without the chaos of scattered information.
Automated alerts serve as an early warning system, flagging upcoming deadlines, policy updates, or potential risks before they escalate. Scheduled reports ensure that stakeholders stay informed, freeing staff from the time-consuming task of manual report preparation.
The real power of a compliance dashboard lies in its ability to turn raw data into actionable insights. Features like color-coded visuals, drill-down tools, and customizable KPIs help prioritize responses effectively. In fact, 78% of compliance professionals report better risk mitigation when using real-time dashboards.
For organizations that rely on form-based data collection - such as policy acknowledgments, incident reporting, or training confirmations - tools like Reform can enhance the process. Reform allows for branded, multi-step forms with conditional routing and real-time analytics, ensuring consistent data quality and an uninterrupted flow of information.
A thoughtfully designed compliance dashboard offers more than regulatory adherence. It fosters transparency, supports well-informed decision-making, and creates the audit trails needed to demonstrate accountability. By shifting compliance from a tedious obligation to a strategic advantage, it becomes a cornerstone of organizational success.
However, the journey doesn’t stop at implementation. To keep your dashboard effective, treat it as a dynamic tool. Regularly review metrics, update key indicators, and gather stakeholder feedback to ensure it adapts to evolving regulations and organizational priorities. This ongoing refinement will help your compliance dashboard remain an indispensable asset.
FAQs
How does a compliance dashboard enhance audit readiness and improve risk management?
A compliance dashboard serves as a central hub for your organization's compliance data, offering a clear and organized view of key metrics. It simplifies the process of monitoring compliance efforts and spotting potential risks before they escalate. By pulling in real-time data and using customizable reporting tools, it allows you to pinpoint gaps, track progress, and stay aligned with regulatory requirements.
This efficient system not only makes audit preparation less stressful but also boosts risk management. It empowers quicker decision-making and helps minimize the chances of non-compliance. A thoughtfully designed compliance dashboard ensures your organization can keep up with regulatory updates and maintain a strong, reliable compliance framework.
How can I choose and integrate reliable data sources for an accurate compliance dashboard?
To build a compliance dashboard you can rely on, start with trusted data sources that align with your compliance requirements. Make sure each source is credible, current, and complete. Using automated tools or APIs for data integration is a smart move - it minimizes manual errors and keeps the process efficient.
When it comes to integration, pay close attention to mapping data fields to match your dashboard's structure. Run thorough tests to ensure data flows smoothly and consistently. To keep everything running accurately over the long haul, conduct regular audits of both your data sources and integration processes.
How can we keep our compliance dashboard secure and protect sensitive data from unauthorized access?
To keep your compliance dashboard secure, start by setting up role-based access controls (RBAC). This approach ensures that only the right people have access to sensitive data, based on their specific roles. Make it a habit to review and update permissions regularly, especially when team responsibilities change.
Protect your data by using encryption - both while it's being transmitted and when it's stored. On top of that, enable multi-factor authentication (MFA) for all users. This adds an extra step to the login process, making it much harder for unauthorized users to gain access.
Lastly, don't skip routine security audits. Regularly check for unusual activity on the dashboard and address any red flags immediately. These proactive steps can go a long way in safeguarding your data and staying compliant.
Related Blog Posts
Get new content delivered straight to your inbox

The Response
Updates on the Reform platform, insights on optimizing conversion rates, and tips to craft forms that convert.


Drive real results with form optimizations
Tested across hundreds of experiments, our strategies deliver a 215% lift in qualified leads for B2B and SaaS companies.
