
.webp)
Custom Dashboards for Lead Generation Insights


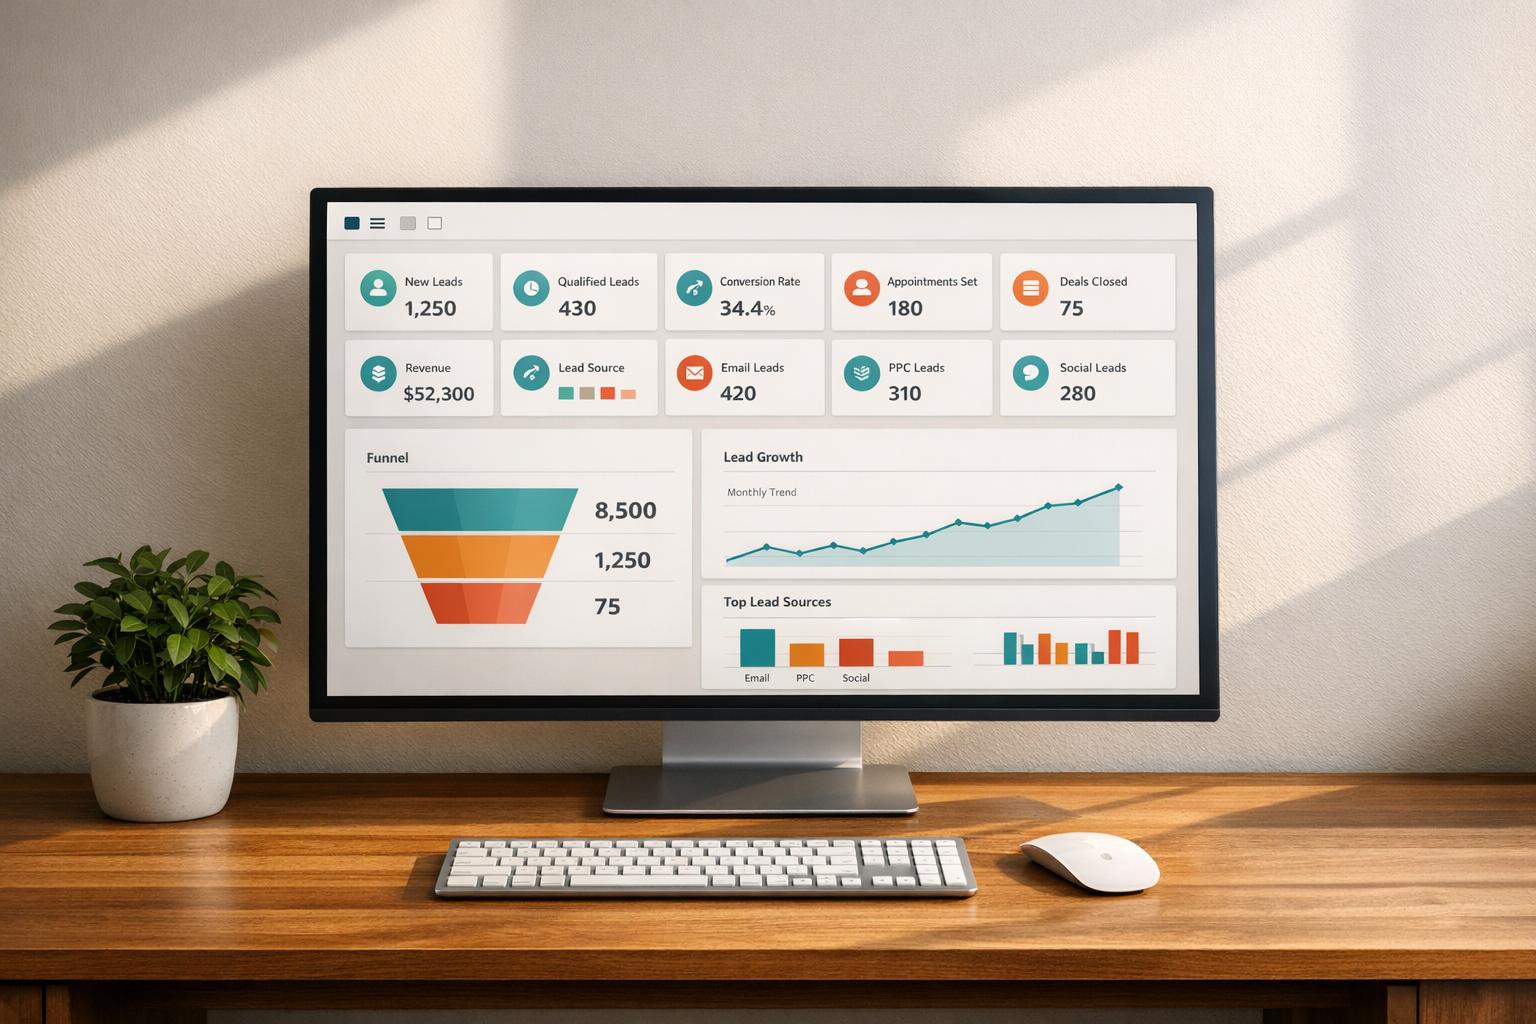
Want to make lead generation easier? A custom dashboard can transform scattered data into clear, actionable insights. Instead of juggling analytics tools, CRMs, and ad platforms, a dashboard centralizes everything - offering real-time updates on key metrics like conversions, Cost Per Lead (CPL), and Customer Acquisition Cost (CAC).
Here’s what you’ll learn:
- Why customization matters: Tailored dashboards highlight metrics relevant to your business, like regional performance or specific lead qualifications.
- Core metrics to track: Focus on funnel stages - traffic sources, MQLs, SQLs, and pipeline velocity.
- Design essentials: Use clear layouts, visual hierarchies, and the right charts (e.g., bar charts for comparisons, line charts for trends).
- Interactivity: Filters, drill-downs, and team-specific views make data actionable.
- Accuracy and speed: Automate data integration, reduce errors, and optimize dashboard performance.
Custom dashboards save time, improve decision-making, and align your team around shared goals. Ready to simplify your lead generation process? Let’s dive in.
Marketing Dashboards Tutorial: Everything You Need to Get Started
Core Metrics and KPIs for Lead Generation
Essential Metrics to Track Across Your Lead Generation Funnel
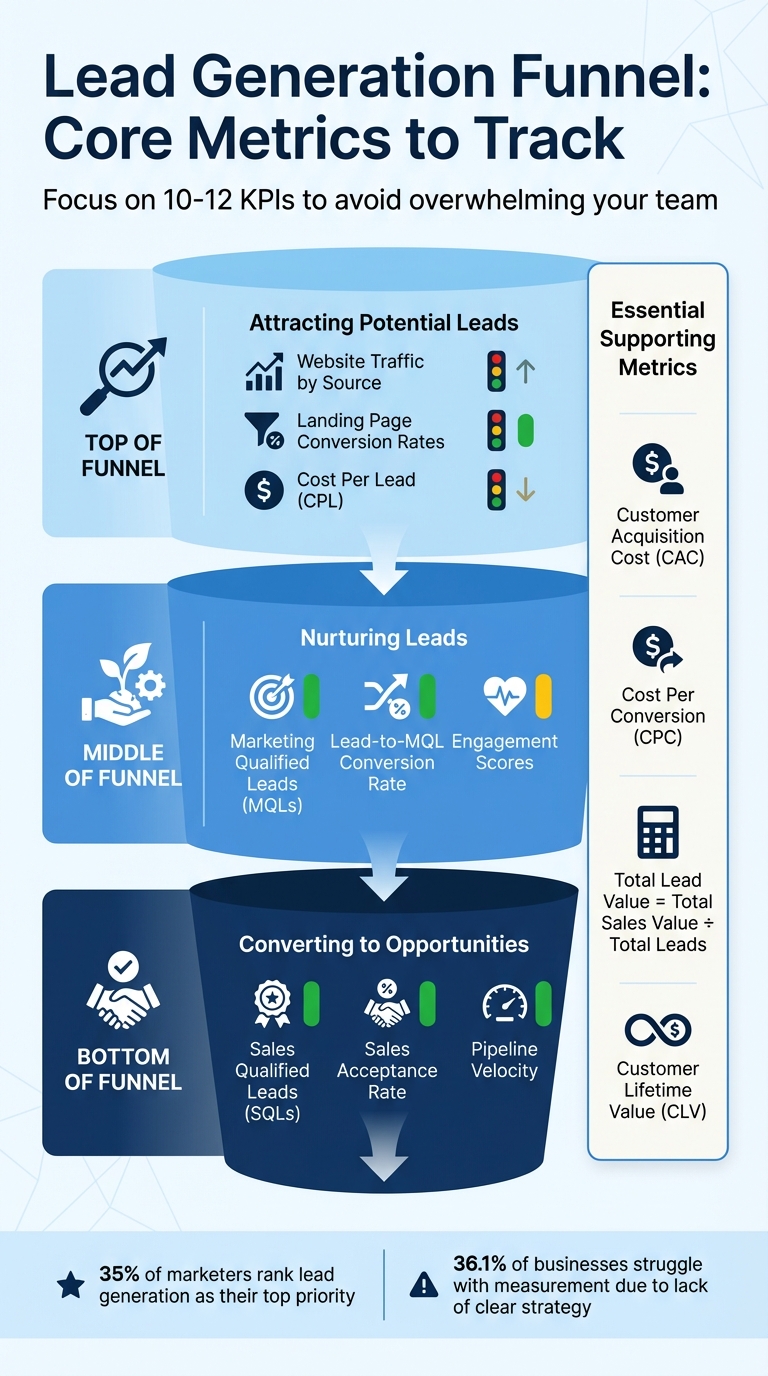
When it comes to building effective dashboards, the key lies in focusing on the right metrics. These metrics should not only align with your business goals but also provide actionable insights. According to research, 35% of marketers rank lead generation as their top priority. Yet, 36.1% of businesses struggle with measurement because they lack a clear strategy. To make your dashboard truly useful, base it on metrics that reflect your funnel stages and business objectives. This approach ensures real-time insights that are both clear and actionable.
Lead Generation Metrics to Track
An effective dashboard organizes metrics based on where leads are in the funnel. Here’s how you can break it down:
- Top of the funnel: Focus on metrics like website traffic by source, landing page conversion rates, and Cost Per Lead (CPL). These help you understand how well you're attracting potential leads.
- Middle of the funnel: Track Marketing Qualified Leads (MQLs), lead-to-MQL conversion rates, and engagement scores to gauge how effectively you're nurturing leads.
- Bottom of the funnel: Monitor Sales Qualified Leads (SQLs), Sales Acceptance Rate, and Pipeline Velocity to assess how well leads are converting into opportunities.
Additionally, cost and efficiency metrics are essential. Metrics like Customer Acquisition Cost (CAC) and Cost Per Conversion (CPC) ensure your campaigns are financially sustainable. Meanwhile, value-driven metrics such as Total Lead Value (calculated as Total Sales Value divided by Total Leads) and Customer Lifetime Value (CLV) help you predict revenue and identify your most valuable customer segments.
How to Prioritize KPIs
Once you've identified the key metrics, the next step is prioritizing the KPIs that truly drive action. Keep your dashboard focused - track only 10–12 KPIs to avoid overwhelming your team with unnecessary data. Start by pinpointing which part of the funnel needs the most attention. For example:
- If you're generating plenty of traffic but struggling with conversions, focus on middle-of-the-funnel metrics like MQL quality and engagement.
- If sales teams are rejecting most leads, prioritize metrics like Sales Acceptance Rate and Lead-to-Opportunity conversion to address misalignment between teams.
Stay away from vanity metrics that don’t inform actionable decisions. For instance, raw social media likes or total page views may look impressive but won’t help you improve campaign performance. Instead, focus on metrics you can directly influence, such as conversion rates, CPL, and SQL volume.
Finally, review your KPIs at least quarterly to ensure they align with your evolving business goals. Use tools like color coding (red/yellow/green) to quickly identify underperforming areas. Tailor the dashboard to different stakeholders’ needs - for instance, B2B managers might focus on MQL and SQL volumes, while digital marketers might prioritize click-through rates and cost per click.
Designing Dashboard Layouts
When it comes to dashboards, a clear and thoughtful layout is the bridge between raw data and actionable insights. Once you've identified your key metrics, the next step is displaying them in a way that provides instant clarity. Visuals play a critical role here, as they can convey information much faster than text. Considering that the average attention span is just eight seconds, your dashboard needs to deliver insights quickly and efficiently. A well-organized layout doesn’t just present data - it can directly influence strategies like lead generation.
Visual Hierarchy Principles
The arrangement of elements on your dashboard significantly impacts how users process information. Start by placing the most critical KPIs in the top-left corner, as this is where attention naturally gravitates. Use this prime space to display metrics that answer key questions, such as the number of leads generated this month or conversion rate trends.
Size matters when guiding attention. Highlight essential KPIs by using larger fonts or widgets, while reserving smaller sizes for less critical details. Organize content following F- or Z-patterns, which reflect how people typically scan a page - starting with high-level insights, then moving to trends, and finally to details.
Group related metrics into logical clusters. For instance, keep campaign performance data together in one section and regional breakdowns in another. Use whitespace, borders, or subtle background colors to create distinct, scannable sections that make the dashboard easier to navigate. As Stephen Few aptly describes:
"A dashboard is a visual display of the most important information needed to achieve one or more objectives that has been consolidated on a single computer screen so it can be monitored at a glance".
Color can also be a powerful tool, but it should be used sparingly and purposefully. For example, apply a "traffic light" system: red for issues, yellow for caution, and green for good performance. This approach makes it easy to spot priorities at a glance. Always aim to meet the 5-second rule: if users can’t find answers to their most pressing questions within five seconds of viewing the dashboard, it’s time to simplify.
The next step is selecting the right visualizations to complement your layout.
Choosing the Right Visualizations
Different types of data call for different visual treatments. Here’s how to match the metric to the method:
- Bar charts: Ideal for comparing categories, such as leads by source or campaign performance. They provide a quick visual ranking.
- Line charts: Perfect for tracking trends over time, such as monthly lead volume or revenue growth. Ensure the line occupies about two-thirds of the y-axis for easy readability.
- Bullet charts: A better alternative to analog gauges for showing progress toward goals, as they take up less space.
- Pie charts: Use these only for datasets with fewer than seven categories and clear differences.
- Heat maps and scatter plots: Great for uncovering patterns, like correlations between marketing spend and conversions.
| Visualization Type | Best Use Case | Lead Gen Metric Example |
|---|---|---|
| Bar Charts | Comparing categories | Leads by Marketing Source |
| Line Charts | Trends over time | Monthly New Leads |
| Bullet Charts | Goal tracking | Monthly Sales Target Progress |
| Scatter Plots | Finding relationships | Ad Spend vs. Conversion Rate |
| Heat Maps | Frequency/Seasonality | Peak Website Traffic Times |
Before adding any visualization, apply the "So What?" test: If a change in the data doesn’t lead to a decision, it’s likely a vanity metric cluttering your dashboard. Keep things simple by rounding numbers and removing unnecessary visual elements.
Mobile Dashboard Design
With mobile devices accounting for 58% of global website traffic, it’s essential to design dashboards that perform well on smaller screens. A mobile-first approach ensures that the most crucial metrics are prioritized.
Instead of side-by-side layouts, stack elements vertically to avoid horizontal scrolling. Show only the top 3–4 KPIs upfront, with "View More" options for additional details. Simplify visualizations for mobile by using sparklines, summary cards, or basic bar charts that are easier to interpret on smaller displays.
Interactive elements like buttons and filters should be at least 44x44 pixels to make them easy to tap. Maintain a minimum contrast ratio of 4.5:1 for text to ensure readability, even in varying lighting conditions.
Test your mobile dashboard at critical breakpoints: 320px for small phones, 768px for tablets, and 1,024px for laptops. To improve performance, pre-aggregate data to meet the speed demands of mobile users.
With these principles in place, your dashboard will be ready to provide a seamless user experience while setting the stage for interactive data exploration.
sbb-itb-5f36581
Interactivity and Data Exploration
Static dashboards give you a snapshot of past performance, but interactive dashboards go a step further - they reveal actionable insights and help drive decisions. This distinction is crucial for improving lead generation, as 67% of businesses consider lead generation dashboards essential to their operations. Without interactivity, reports often remain surface-level, leaving your team without the deeper insights needed to make impactful changes. Interactive features turn data into a tool for refining strategies.
Filters and Drill-Down Options
Simple date range filters can prevent misleading conclusions. By comparing performance across different timeframes - this week versus last month or the same quarter last year - you can uncover seasonal trends and measure the impact of specific campaigns.
Filtering by channels like SEO, social media, paid ads, or email allows you to dig deeper into which campaigns are delivering high-quality leads. Interactive funnel views can highlight where leads drop off in the process. For example, if you see a significant drop in Marketing Qualified Leads (MQLs) before they convert to Sales Qualified Leads (SQLs), you've pinpointed a bottleneck that needs attention. Geographic filters, meanwhile, can help you compare performance across regions, revealing untapped opportunities or regional differences.
| Feature | What It Does | Lead Generation Benefit |
|---|---|---|
| Date Range Filters | Compare performance over different timeframes | Identifies seasonal trends and campaign timing effects |
| Channel Segmentation | Break data down by source (SEO, social, paid, email) | Highlights channels producing the best leads |
| Drill-Down Options | Dive into metrics for detailed insights | Helps uncover root causes of performance changes |
| Regional Filtering | Analyze performance by geography | Reveals high-performing or underperforming markets |
To take it further, set automated Slack or email alerts for critical KPI thresholds. These alerts can turn your dashboard into an early warning system, ensuring timely action.
Customizing Dashboards for Different Teams
Interactivity is only part of the equation - customizing dashboards for specific teams ensures everyone sees the metrics that matter most to them. Marketing, sales, and leadership all have different priorities, and a one-size-fits-all dashboard rarely works. Tailored views help each group focus on their goals.
Marketing teams thrive on top-of-funnel metrics like website traffic by source, landing page conversion rates, cost per lead, and MQL volume. Sales teams, on the other hand, need bottom-of-funnel data, such as SQLs, sales acceptance rates, pipeline velocity, and deal progression. Meanwhile, leadership requires a broader view, including ROI, total pipeline value, customer lifetime value, and revenue versus targets.
For example, marketing shouldn’t be bogged down with sales-specific metrics, just as sales teams shouldn’t waste time on data outside their control. Segmenting by account size can also be revealing for B2B teams - mid-market accounts might deliver better revenue impact than enterprise deals. A case in point: Impulse Creative, a marketing agency, used customized real-time dashboards to focus on specific lead generation metrics and boosted client lead generation by 15%.
Use color coding - red for issues, yellow for caution, green for success - so teams can quickly gauge performance without diving into the details. The ultimate goal? A unified "single source of truth" that aligns marketing and sales by combining marketing automation data with CRM platforms like Salesforce or HubSpot.
Data Accuracy and Performance
The value of your lead generation dashboard depends entirely on the quality of the data it presents. If the data is outdated or incorrect, it can lead to poor decisions and missed opportunities. For example, sales teams without access to real-time lead insights waste up to 40% of their time chasing leads that never convert. To get the most out of your dashboard, you need to focus on two key elements: maintaining accurate data and ensuring the dashboard runs efficiently.
Data Integration and Automation
Relying on manual data entry is a surefire way to introduce errors. Instead, automated data syncing can pull information directly from systems like your CRM, Google Analytics, and social media platforms in real time, reducing the chances of human mistakes. As Prashanth Southekal, Founder of DBP-Institute, advises:
"If the data is sourced from multiple transactional systems, it is better to implement a data warehouse and source the data for the dashboard from this canonical system".
To further improve data accuracy, set up validation rules and schedule regular audits to catch issues like duplicates or incomplete records. Standardizing how data is entered across teams can also help maintain consistency. Businesses that pair lead scoring with robust data practices often see up to a 70% boost in lead generation ROI. Once your data is clean and well-integrated, the next challenge is making sure your dashboard operates quickly and efficiently.
Performance Optimization Strategies
A slow dashboard can frustrate users and delay crucial decisions. The performance of SQL queries is particularly important for keeping dashboards responsive. To ensure smooth operation, aim to keep your dashboard under 25 queries and limit visualizations to 50 or fewer columns.
Caching is another effective way to improve performance. Sync your dashboard's refresh rate with your ETL (Extract, Transform, Load) process to avoid unnecessary queries when the data hasn’t changed. For instance, if your ETL updates every hour, setting shorter refresh intervals will only waste resources. Other strategies include using "Top N" filters to display fewer items and breaking large dashboards into smaller, more focused segments. These steps can significantly reduce memory usage and improve load times.
Validating and Testing Dashboards
Even after optimizing performance, ongoing testing is essential to maintain data quality. Regularly test for accuracy, consistency, relevance, completeness, and timeliness by profiling your data and comparing it against reliable benchmarks.
It’s also a good idea to create a Minimum Viable Product (MVP) version of your dashboard. This allows you to gather feedback from stakeholders before committing to the final design. Francis Liming from LeadScale highlights the importance of staying updated:
"In the same way that minor changes to a couple of cells in a spreadsheet can cause other areas of the report to display errors, not keeping up with platform API developments can make a previously functioning dashboard unusable".
To catch problems early, use data observability tools that send real-time alerts when data flows break or when updates are needed. These tools can help you stay ahead of issues that could disrupt your dashboard’s functionality.
Conclusion
Key Takeaways
Custom dashboards bring together data in a way that delivers immediate, actionable insights. By focusing on 10–12 core KPIs, you can avoid overwhelming your team with too much information and instead zero in on the metrics that truly impact results.
The best dashboards automate data integration to ensure real-time accuracy. Jonathan Taylor from Klipfolio highlights this perfectly:
"A dashboard has the unique ability to surface metrics to your entire team and translate data into insight".
This shared understanding allows marketing and sales teams to align on key metrics like lead quality, conversion rates, and ROI. With a clear visual hierarchy and color-coded indicators, your dashboard becomes more than a data display - it becomes a guide for your next steps. From there, the focus shifts to actionable implementation.
Next Steps for Building Your Dashboard
Start by defining your goals in collaboration with key stakeholders. Pinpoint the critical stages in your funnel and the metrics that can be influenced.
Next, map out where your data is currently stored - whether it’s in your CRM, Google Analytics, or ad platforms. This will help you identify the integrations you need. Choose a tool that fits both your budget and technical capabilities.
Set up automated data refreshes on a schedule that works for your team - hourly, daily, or weekly - so you’re always working with the latest information.
Begin with a minimum viable dashboard. Roll it out, gather feedback, and adjust your KPIs as your priorities shift. By following these steps, you can turn your dashboard into a powerful tool that helps your team make smarter, faster decisions.
FAQs
How can custom dashboards enhance lead generation performance?
Custom dashboards offer a real-time snapshot of your lead generation metrics, including traffic sources, conversion rates, cost-per-lead, and lead statuses. By centralizing all this data, teams can easily pinpoint which campaigns are bringing in top-quality leads and which ones might need tweaking. This streamlined view supports quicker, data-driven decisions.
You can tailor these dashboards to highlight the KPIs that are most critical to your business goals. Plus, you can set up alerts for sudden shifts - like a drop in conversion rates or a surge in lead activity - so you can address potential issues right away. Pair these dashboards with Reform’s real-time form analytics, and you can turn raw data, such as validation rates or form abandonment points, into meaningful insights. The result? Better lead quality and improved efficiency across the board.
What key metrics should I include in a lead generation dashboard?
A well-designed lead generation dashboard gives you a clear picture of how many leads you're bringing in, how well they're converting, and what you're spending to acquire them. Here are the key metrics to keep an eye on:
- Website traffic by source: Understand which channels - like organic search, paid ads, or referrals - are bringing in the most visitors and potential leads.
- Landing page conversion rate: Measure the percentage of visitors who take action, such as filling out forms or downloading gated content, to see how effective your pages and messaging are.
- Cost per lead (CPL): Keep track of how much you're spending to secure each qualified lead, helping you stay on top of budgets and return on investment.
- Total leads: Monitor the total number of leads, both inbound and outbound, entering your pipeline to gauge overall performance.
- Lead source breakdown: Pinpoint which channels are delivering the best-quality leads so you can allocate resources more effectively.
- Conversion funnel rates: Analyze how prospects progress through key stages, like moving from visitor to lead or lead to qualified status, to identify areas that need improvement.
By keeping tabs on these metrics, you’ll gain real-time insights into your lead generation strategy, making it easier to fine-tune your approach and get the most out of your efforts.
How can I keep my lead generation dashboards accurate and fast?
To keep your lead generation dashboards running smoothly and delivering accurate insights, start with clean, verified data. Use tools like real-time email validation, phone number verification, and lead enrichment to catch errors or fake entries early. Regular audits are essential - check for duplicate, inconsistent, or outdated records to ensure your data remains reliable.
For better performance, process data at the database level before it reaches the dashboard. This could mean calculating daily totals or rolling averages beforehand. Choose refresh intervals wisely - real-time updates work well for alerts, while hourly updates are better suited for tracking trends. Keep your visualizations straightforward; too many widgets or overly complex charts can clutter your dashboard and make it harder to interpret.
Lastly, integrate your dashboard directly with your marketing automation tools. This removes the need for manual updates and ensures real-time syncing across platforms. When you combine verified data, efficient data handling, and a clean design, your dashboards will provide quick, reliable insights that are easy to act on.
Related Blog Posts
Get new content delivered straight to your inbox

The Response
Updates on the Reform platform, insights on optimizing conversion rates, and tips to craft forms that convert.


Drive real results with form optimizations
Tested across hundreds of experiments, our strategies deliver a 215% lift in qualified leads for B2B and SaaS companies.
