
.webp)
Ultimate Guide to Data Templates for Marketing Automation


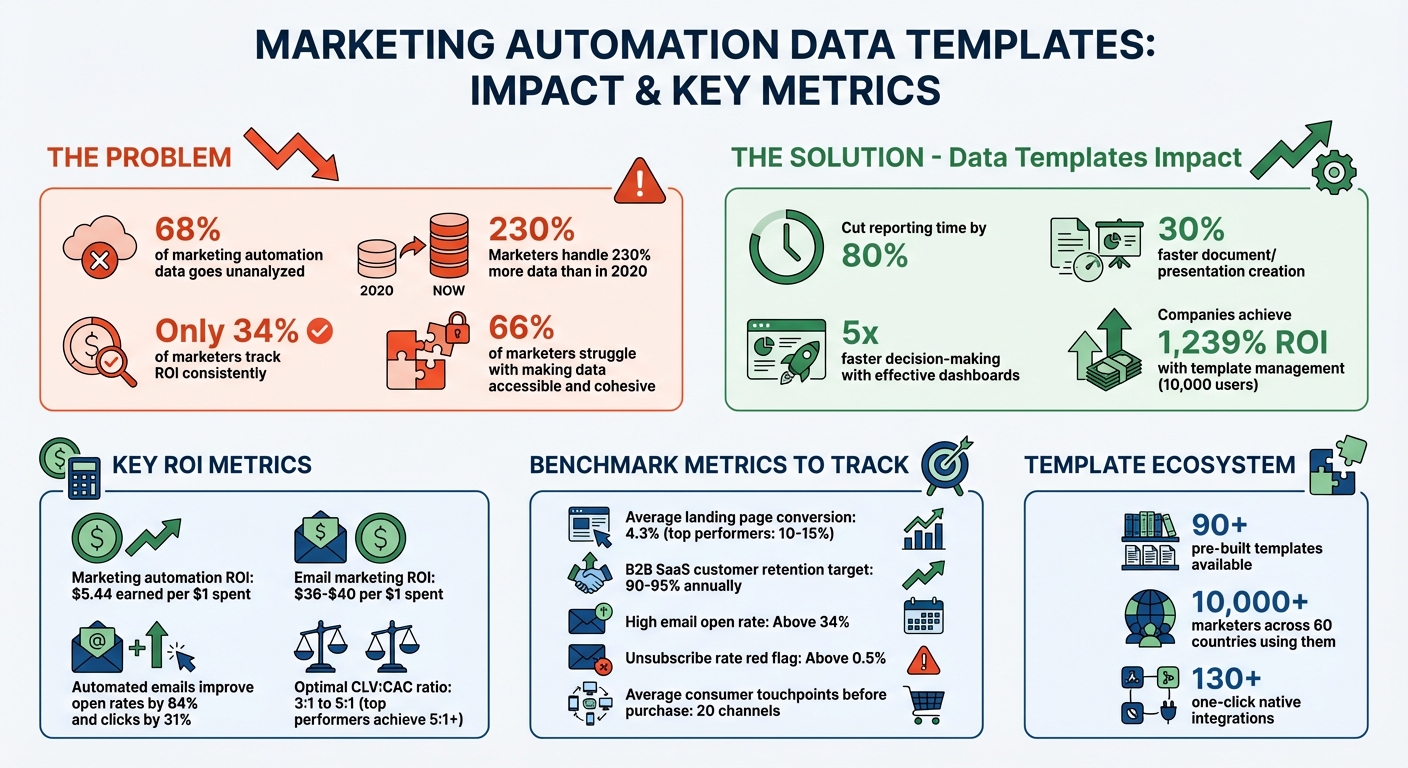
Marketing automation generates loads of data - email clicks, ad spend, website visits, and more - but 68% of it goes unanalyzed. That’s where data templates come in. They organize raw data into clear, actionable insights, saving time and reducing errors.
Here’s what you’ll learn:
- What data templates are: Tools that standardize and visualize marketing data for better decision-making.
- How they help: Cut reporting time by 80%, ensure consistent KPIs, and improve ROI tracking (companies earn $5.44 for every $1 spent on marketing automation).
- Key metrics to track: Lead conversions, email engagement, and campaign ROI.
- Top templates: Examples include HubSpot dashboards, Mailchimp analytics, and Google Analytics + CRM integrations.
- How to build templates: Plan layouts, automate data inputs, and tailor templates for specific roles.
Marketing Automation Data Templates: Key Statistics and ROI Metrics
📈 Top 14 Marketing Reporting Templates in 2025
Key Metrics and KPIs to Track Using Data Templates
As we’ve discussed, standardization is crucial for making sense of the data that marketing automation generates. But what metrics actually matter? Marketing automation produces an overwhelming amount of data, yet focusing on the right ones - like lead progress, email performance, and campaign revenue - can make all the difference. Below, we’ll break down the essential KPIs and show how templates can transform raw numbers into actionable insights.
Lead Conversion Rates and Funnel Performance
Data templates are incredibly useful for tracking how leads move through your funnel - from Marketing Qualified Leads (MQLs) to Sales Qualified Leads (SQLs) and, finally, to closed deals. This process helps identify bottlenecks that may be slowing down your conversions. Considering that marketers now handle 230% more data than they did in 2020, having a clear picture of your funnel is more important than ever.
Templates also allow for side-by-side comparisons of acquisition sources, so you can measure which channels are performing best. For example, while the average landing page conversion rate sits around 4.3%, top-performing pages can hit 10–15%. In B2B SaaS, companies often aim for customer retention rates between 90% and 95% annually - a benchmark that templates can help you monitor.
Email Marketing Engagement Metrics
Email marketing remains a powerhouse in automation, delivering an impressive return of $36 to $40 for every $1 spent. Templates help you keep an eye on key metrics like Open Rates, Click-Through Rates (CTR), Inbox Deliverability, and Unsubscribe Rates.
For instance, high open rates (above 34%) paired with low click-through rates could indicate that your subject lines are grabbing attention, but the email content isn’t delivering. Automated emails can improve open rates by 84% and clicks by 31%. Templates can also flag potential red flags, like an unsubscribe rate exceeding 0.5%, which might suggest your messaging is either too frequent or missing the mark.
"Marketing automation KPIs aren't just numbers on a dashboard; they're the compass that keeps campaigns aligned with business goals".
Next, we’ll explore how revenue attribution metrics can give you an even sharper understanding of your campaigns.
Campaign ROI and Revenue Attribution
Tracking revenue is where templates truly shine, offering insight into metrics like Return on Investment (ROI), Return on Ad Spend (ROAS), and Revenue per Lead (RPL). Despite the importance of these metrics, only 34% of marketers track ROI consistently, and 72% of marketing leaders struggle with demonstrating ROI due to poor attribution models.
Multi-touch attribution templates solve this problem by allocating revenue across all touchpoints. This is critical as today’s consumers interact with an average of 20 channels before making a purchase. These insights can lead to significant gains. For example, optimizing call-to-action (CTA) placement based on revenue-per-session data can dramatically improve conversions.
"With heatmap, I've been able to figure out what elements actually increase AOV and optimize our landing pages to drive more first purchase profitability, we're up 23% YoY".
Templates also help track Customer Lifetime Value (CLV) alongside Customer Acquisition Cost (CAC). A strong CLV-to-CAC ratio typically ranges between 3:1 and 5:1, though top-performing businesses can achieve ratios of 5:1 or better. Since CAC varies widely across industries, templates make it easier to benchmark your performance against industry standards.
Top Data Visualization Templates for Marketing Automation
With over 90 pre-built templates available, setting up a marketing automation dashboard has never been easier. These templates are trusted by more than 10,000 marketers across 60 countries and support over 130 one-click native integrations with tools like HubSpot, Mailchimp, and Google Analytics. While executives need a big-picture view of ROI, campaign managers focus on detailed performance metrics. Below, we’ll explore three templates designed to tackle specific marketing needs.
HubSpot Marketing Dashboard Template
The HubSpot Marketing Dashboard Template provides a complete overview of the marketing funnel, tracking everything from website traffic to closed deals. It automatically gathers key metrics like new contacts (excluding offline sources), new customers, blog views, and overall ROI. This makes it especially useful for demonstrating marketing’s value to leadership. The template combines content marketing performance with sales funnel data, using scorecards for high-level KPIs and funnel charts to highlight conversion rates at each stage. This setup makes it easy to pinpoint areas that need attention.
For teams juggling multiple campaigns, the drag-and-drop functionality allows customization with metrics like Cost per Lead or Sales Cycle Length. Agencies frequently use the white-labeling option to apply their branding and color schemes before sharing reports with clients.
Mailchimp Email Analytics Template
The Mailchimp Campaign Performance Template turns email marketing data into actionable insights. It emphasizes subscriber growth, audience health, and engagement metrics like open rates, click-through rates, delivery rates, and bounce rates. Line charts track trends in subscriber growth and engagement, while tables break down performance by individual campaigns. This structure helps marketers quickly identify strengths and areas for improvement.
Google Analytics and CRM Combined Template
The Monthly Marketing Performance Template merges web traffic data from Google Analytics 4 (GA4) with CRM metrics from platforms like HubSpot. By combining GA4 metrics like New Users and Sessions with CRM data such as New Contacts by Source, this template offers a unified view of channel performance. This integration tackles a common challenge for 66% of marketers - making data accessible, timely, and cohesive. You can see how organic search, paid ads, and social media collectively drive both traffic and revenue in one place. Bar charts compare channel performance, while geo maps visualize traffic sources by location.
"Being able to blend data across multiple paid channels and getting a unified view of campaigns is a huge value-add for our clients." - Sean Whitmore, Director of Digital, Snapshot Interactive
To maximize the value of these templates, segment your data by channel (organic vs. paid), time period (daily, weekly, monthly), and audience demographics. This segmentation transforms raw data into actionable strategies, helping refine marketing investments.
sbb-itb-5f36581
How to Build and Automate Custom Data Templates
Steps to Plan and Design Your Template
Start by focusing on the key questions your stakeholders need answered. For example, questions like, "Which channels generate leads under $50 CPL?" help avoid cluttered dashboards filled with irrelevant data. This is crucial, as 40% of users rate their dashboards poorly (3 out of 5 or lower) because they fail to support meaningful decision-making.
After identifying these questions, choose actionable KPIs that directly inform decisions - like Customer Acquisition Cost (CAC), Return on Ad Spend (ROAS), and Lead Conversion Rates. Before diving into the build, sketch out your layout. Use wireframing tools to organize elements like scorecards, trend lines, and tables. Place the most critical KPI in the top left corner for maximum visibility. Julia Moreno from Dataslayer emphasizes:
"If someone can't understand your dashboard's main message within five seconds, it's too complicated".
For aesthetics, apply the 60-30-10 color rule: 60% primary, 30% secondary, and 10% tertiary colors. Use bold, large fonts for key numbers so busy executives can quickly scan the dashboard.
Once your layout is ready, the next step is integrating your data.
Connecting Data Sources and Automating Updates
With your design in place, automate your data streams to ensure accuracy and efficiency. Ditch manual CSV exports in favor of automation platforms like Coupler.io, Supermetrics, or Improvado. These tools integrate with over 60 marketing apps, pulling data from sources like Facebook Ads, Google Ads, and Google Analytics into a unified dataset for visualization.
Set up scheduled refreshes based on your reporting needs - hourly updates for active campaigns and daily updates for broader performance tracking. Include data freshness timestamps and anomaly detection flags, as 67% of users lose trust in analytics when dashboards display outdated information. For complex reporting involving more than five data sources, consider using a data warehouse like BigQuery or Snowflake. Keep in mind that Looker Studio has a limit of blending data from no more than five sources simultaneously. To avoid manual errors, stick to strict naming conventions, such as [Channel][Campaign Type][Audience], ensuring seamless data blending.
Using Pre-Built Templates as Starting Points
Pre-built templates offer a great starting point, speeding up setup while aligning with the streamlined approach discussed earlier. Begin with placeholder or sample data, such as GA4 sample data, to finalize your layout. Once the structure is set, map real data fields without disrupting the design. Create a custom theme that reflects your brand's colors, fonts, and chart styles to maintain consistency across all reports.
Design dashboards with specific audiences in mind. For instance, provide executives with high-level KPIs, managers with trend and channel performance data, and specialists with detailed campaign metrics. Tailoring views to meet different roles ensures each stakeholder gets the insights they need. Companies with effective dashboards make decisions five times faster and reduce reporting time by up to 80%.
Add an instructions section explaining how to duplicate the report and connect personal data sources. Always include context for every metric by showing comparison periods (e.g., "vs. last month"), progress toward goals (e.g., "% to target"), and industry benchmarks. This context transforms raw data into actionable insights, empowering better decision-making.
Integrating Reform for Better Data Collection and Insights

Continuing our look at how standardized data enhances automation, Reform takes data collection and insights to the next level with its robust features.
How Reform Optimizes Data Collection
Reform’s multi-step forms and conditional routing are designed to gather structured, high-quality data that seamlessly integrates into your marketing automation workflows. These multi-step flows leverage conditional logic and real-time enrichment to ensure precision in data capture. For example, B2B leads might be routed to questions about company size, while B2C visitors see entirely different fields tailored to their needs.
The platform’s real-time enrichment feature automatically appends job titles and company details during the form submission process. This reduces the number of fields users need to fill out, while still delivering a rich dataset. A great example of its impact: ExactBuyer saw a 90% demo engagement rate and cut exit rates by 26.4% after using Reform’s multi-step forms with real-time enrichment. Edan Krolewicz, Founder and CEO of ExactBuyer, summed it up perfectly:
"Multi-step form → Higher engagement. Dynamic routing → Better qualified leads. Real-time enrichment → Improved experience".
Additional features, like email validation and spam prevention, ensure that only high-quality submissions make it to your dashboards. Even users who abandon forms mid-completion aren’t lost - Reform tracks partial submissions to capture valuable data.
Now, let’s dive into how Reform connects this data to your visualization templates.
Seamless Integration with Data Visualization Templates
Reform offers native integration with HubSpot, allowing form submissions to automatically update contacts, companies, and deals without manual input. You can map specific form fields directly to HubSpot properties, ensuring a smooth flow of data into your HubSpot Marketing Dashboard Template. Plus, the "Send partial form submissions" feature captures leads who abandon forms, keeping your pipeline as complete as possible.
For those using Google Sheets, Reform’s integration updates your spreadsheets in real time, providing a live data feed for visualization tools. Reform also supports Zapier and webhooks, enabling automated data transfers to a variety of platforms, from email analytics dashboards to custom reporting setups. Hidden fields in forms can even capture UTM parameters (like utm_source, utm_medium, and utm_campaign) and map them to CRM properties. This ensures your marketing attribution data is accurate and readily available in your templates.
These integrations not only simplify data management but also pave the way for better conversion tracking, which we’ll explore next.
Enhancing Conversion Tracking with Reform
Reform’s real-time analytics provide instant updates on form submissions, conversion rates, and user behavior. This means your templates can dynamically display performance metrics like lead volume and drop-off points, helping you make quicker, more informed decisions. For instance, GrowthMatch used Reform’s personalized logic and interactive design to ensure only qualified leads could book meetings. Within 30 days, this approach delivered high-value matches directly to their CRM.
Abandoned submission tracking adds another layer of insight by visualizing where prospects drop off in the funnel. Funnel charts make it easy to spot problem areas. A practical example: heyMarvin implemented multi-step forms with logic-based routing, which streamlined lead handoff and routed prospects to two separate AE Calendly flows - all within two weeks.
Reform’s lead enrichment capabilities also improve metrics like lead scoring by automatically appending firmographic data. This enriched data helps highlight top-tier prospects in your HubSpot dashboards, making it easier to prioritize follow-ups and focus on leads with the highest potential.
Conclusion
Key Advantages of Using Data Templates
Data templates can revolutionize marketing automation by saving time and boosting ROI. For instance, organizations have reported a 30% faster creation of documents and presentations, directly contributing to profitability. In fact, marketing automation often delivers a return on investment exceeding five times the initial spend.
Templates also ensure consistency in branding and data across all channels, minimizing errors caused by manual data handling. They act as a "single source of truth", aligning marketing and sales teams to work from the same reliable dataset. With 68% of organizational data going unanalyzed, templates make it easier to utilize this data effectively. By converting raw numbers into visual patterns, they enable real-time anomaly and trend detection, cutting down the delays associated with manual analysis.
Scalability is another critical factor. Templates allow teams to handle increasing data and campaign volumes without the need for significant staffing increases. For example, companies with 10,000 users have achieved an ROI of 1,239% through template management. As the Lenskold Group highlights:
"Companies making improvements in their measurement and ROI capabilities were more likely to report outgrowing competitors and a higher level of effectiveness and efficiency in their marketing".
With these benefits in mind, the next step is to integrate templates into your workflows for maximum impact.
Actionable Steps for Marketers
To capitalize on these advantages, start by auditing your workflows to pinpoint repetitive, time-consuming tasks - like manual email follow-ups, data entry, or report generation. Use the "Who, Why, What" framework: identify who will use each template, why they need it, and what specific data it should include. This method avoids the common pitfall of collecting excessive data that doesn’t translate into actionable insights.
Before diving into automation, prioritize data hygiene. Clean and validate your existing data because poor-quality input leads to poor outcomes - "Garbage In, Garbage Out". Standardize naming conventions for campaigns across platforms to avoid fragmented and messy data. Begin with three high-impact workflows, such as welcome email series or lead nurturing campaigns, and expand from there.
Leverage tools like Reform to gather structured, high-quality data. Features like real-time enrichment, email validation, and integrations with platforms like HubSpot and Google Sheets ensure your templates are supplied with accurate, actionable information. Start with a soft launch targeting a small pilot audience, monitor performance metrics monthly, and refine your strategy. Keep in mind, significant ROI from marketing automation typically takes 6 to 12 months to materialize, though efficiency improvements will be noticeable right away.
FAQs
How can data templates boost ROI in marketing automation?
Data templates can significantly boost ROI in marketing automation by turning raw data into actionable insights while cutting down on manual work. By using standardized fields, consistent audience segmentation, and clear metrics, these templates help ensure that automation workflows operate smoothly and efficiently. This means cleaner data, smarter decision-making, and more impactful campaigns.
Take, for instance, branded, multi-step forms designed to capture high-quality leads. These forms not only improve completion rates but also simplify lead management. When combined with automation workflows, the process becomes even more streamlined - leads are automatically nurtured, scored, and routed, saving time and driving faster revenue growth. Additionally, by embedding practices like proper naming conventions and consistent data formatting, templates reduce the need for tedious data cleanup, freeing marketers to focus on strategy and outcomes.
The payoff? Shorter sales cycles, improved conversion rates, and measurable ROI gains - such as a 20% increase in revenue for every $1 spent.
What are the most important metrics to track with data templates in marketing automation?
When incorporating data templates into your marketing automation strategy, hone in on metrics that can drive meaningful decisions. Start by analyzing campaign performance metrics like open rates, click-through rates (CTR), and subscriber engagement. These figures help you measure how effectively your emails and automated workflows connect with your audience.
Then, turn your attention to lead generation metrics. Focus on the sources of your leads and the conversion rate from visitor to qualified lead. These metrics shed light on which channels and tactics are delivering the highest return on investment.
Finally, evaluate workflow efficiency by keeping tabs on completion rates and drop-off points in multi-step forms or automation sequences. Pinpointing areas where users lose interest allows you to fine-tune processes and improve conversions. Tools like Reform's no-code, conversion-focused form templates make it simple to gather and sync these data points into your dashboards, ensuring your metrics stay up-to-date and aligned with your objectives.
How do I automate data input for my marketing templates?
You can simplify data input for your marketing templates by using Reform’s integrations and data mapping features. Start by designing a custom form in Reform with all the fields you need - like name, email, or company revenue. Reform is built with U.S. standards in mind, supporting conventions like the dollar sign ($) for currency and MM/DD/YYYY for dates.
Once your form is ready, map each field to its corresponding entry in your CRM or analytics tool. During this step, you can also set formatting rules to ensure consistency, such as standardizing phone numbers or date formats. After mapping, activate the integration to automatically send form submissions to your selected platform, saving you from tedious manual data entry.
For more complex workflows, you can connect with tools like Google Tag Manager to trigger specific actions. For example, you could fire conversion pixels or update analytics dashboards. Before going live, test the setup with sample submissions to confirm that everything works as expected. Once your form is live, Reform’s real-time analytics will let you track submissions and fine-tune your forms for cleaner, more reliable data.
Related Blog Posts
Get new content delivered straight to your inbox

The Response
Updates on the Reform platform, insights on optimizing conversion rates, and tips to craft forms that convert.


Drive real results with form optimizations
Tested across hundreds of experiments, our strategies deliver a 215% lift in qualified leads for B2B and SaaS companies.
