
.webp)
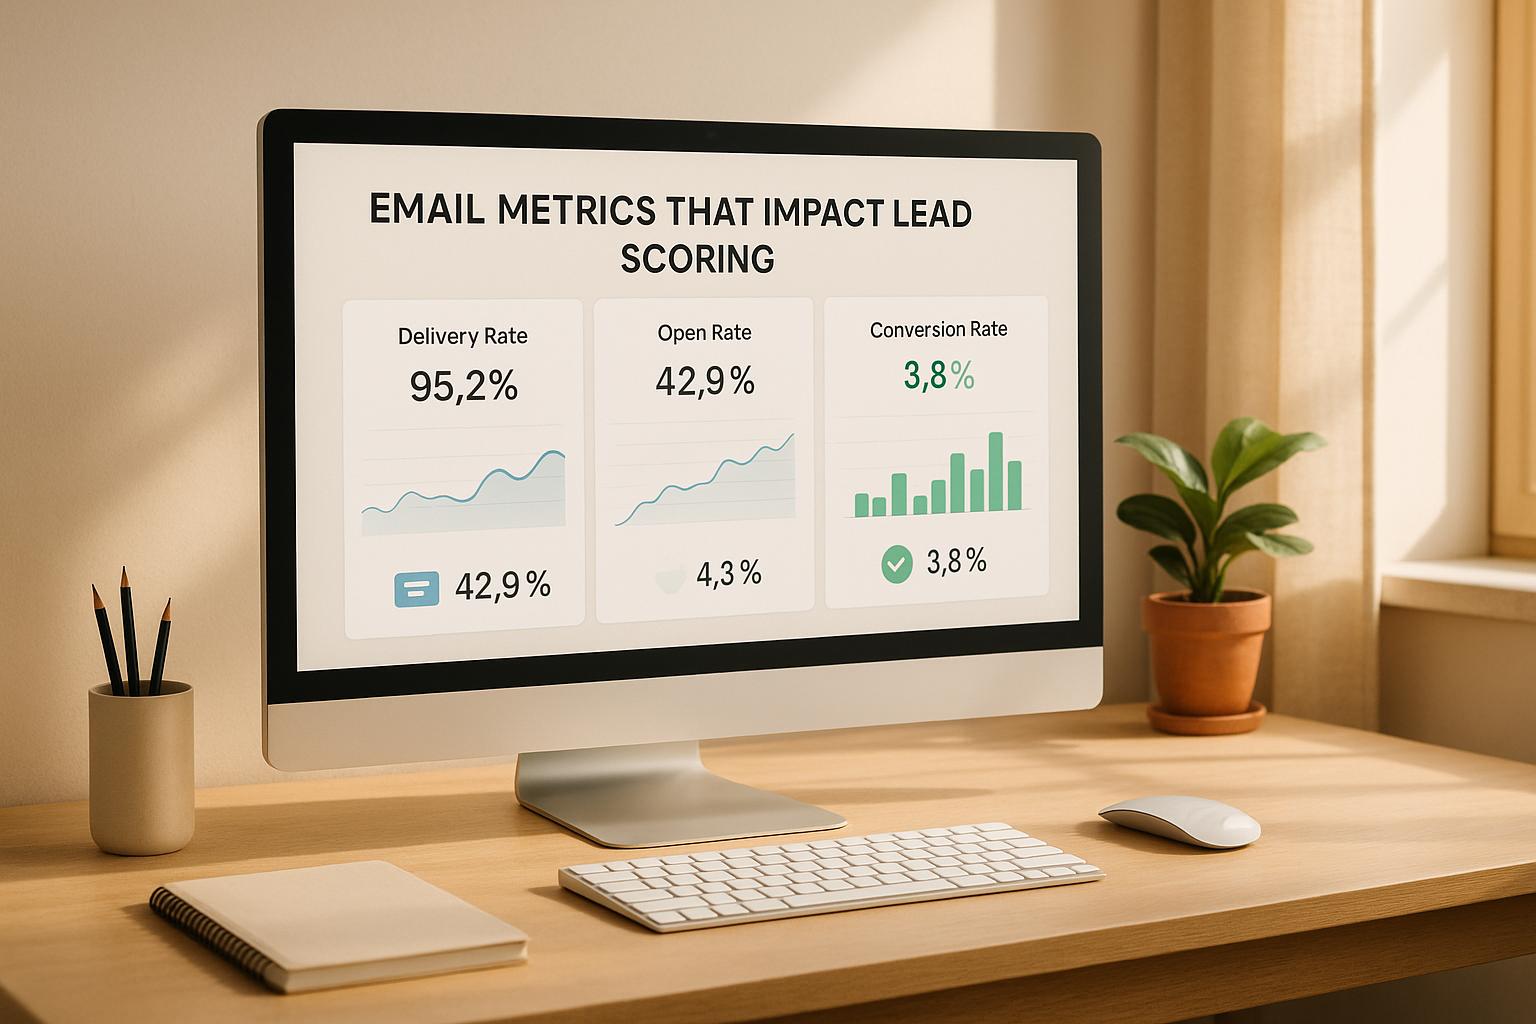
Email Metrics That Impact Lead Scoring


Email metrics are essential for identifying which leads are worth pursuing and which need more nurturing. Key metrics like delivery rate, open rate, click-through rate (CTR), and conversion rate help measure engagement and intent, allowing you to prioritize high-quality leads. Tools like Reform make it easier to track these metrics and integrate them into lead scoring models.
Here’s a quick breakdown of the most impactful email metrics:
- Delivery Rate: Measures how many emails successfully reach inboxes. A high rate ensures accurate engagement tracking.
- Open Rate: Indicates initial interest by tracking how many recipients open your emails.
- Click-Through Rate (CTR): Shows active engagement by measuring how many recipients click on links.
- Click-to-Open Rate (CTOR): Evaluates content effectiveness by comparing clicks to opens.
- Conversion Rate: Tracks meaningful actions like purchases or demo requests, signaling strong intent.
- Bounce Rate: Identifies invalid or unreachable email addresses, which can distort your data.
- Unsubscribe Rate: Highlights disengagement and helps refine your audience targeting.
- Spam Complaint Rate: Flags issues with messaging or targeting, impacting sender reputation.
- Email Engagement Score: Combines multiple metrics into a single score for a comprehensive view of lead quality.
Why Is Email Lead Scoring Important? - TheEmailToolbox.com
1. Delivery Rate
Delivery rate represents the percentage of emails that successfully land in recipients' inboxes, excluding those that bounce. It's calculated using the formula: (emails delivered ÷ total emails sent) × 100. For instance, if 9,800 out of 10,000 emails are delivered, the delivery rate would be 98%.
This metric is the foundation of email engagement tracking for lead scoring. If emails don't reach their destination, you can't measure opens, clicks, or any other actions that indicate a lead's interest. That’s why maintaining a high delivery rate is essential for collecting accurate data.
How It Impacts Lead Scoring
Low delivery rates can disrupt lead scoring by leaving gaps in your data. When emails bounce due to invalid addresses or spam filters, you lose the ability to gauge a lead's true level of engagement. These blind spots not only obscure valuable insights but also waste resources on undeliverable contacts.
Connection to Engagement and Conversion
A strong delivery rate reflects the quality of your contact list. Accurate and valid contact information is critical for reaching the right audience and driving meaningful engagement. When emails consistently make it to legitimate inboxes, you increase the chances of leads interacting with your content, which generates the data needed for effective scoring and conversion efforts.
Easy to Measure and Track
Delivery rate is one of the simplest email metrics to monitor, thanks to modern email marketing tools. These platforms automatically track delivery performance by analyzing bounce notifications and server confirmations. Features like real-time email validation and spam prevention further improve delivery rates by identifying invalid addresses before emails are sent. This proactive approach ensures cleaner data and more reliable lead scoring.
Role in Sales Readiness
Although delivery rate alone doesn’t indicate sales readiness, it lays the groundwork for collecting the behavioral data that does. Leads with consistently high delivery rates provide a wealth of engagement signals over time, helping you identify patterns that suggest buying intent. To maintain strong delivery performance, experts recommend regularly cleaning email lists, using trusted email service providers, authenticating your sender identity, and keeping bounce rates in check. These practices ensure your lead scoring models are built on dependable data, not incomplete or misleading information.
2. Open Rate
Open rate measures the percentage of delivered emails that are opened. It’s calculated using the formula: (emails opened ÷ emails delivered) × 100. For example, if 200 emails are opened out of 1,000 delivered, the open rate is 20%. After ensuring emails are delivered, this metric provides the first real insight into how recipients are engaging.
Where delivery rate confirms that emails made it to inboxes, open rate takes it a step further by showing whether recipients are interacting with them. It’s a behavioral indicator, offering a glimpse into recipient interest based on their actions rather than self-reported data.
Impact on Lead Scoring Accuracy
Open rate acts as an initial filter to separate engaged leads from those who may not be interested. Leads with high open rates typically receive higher scores, while low open rates might signal the need for re-engagement campaigns. However, open rate alone isn’t enough - it works best when combined with other metrics.
“Recognizing open rate as a preliminary indicator, a B2B marketing agency integrated it into their lead scoring model by identifying leads that consistently opened product update emails. By assigning these leads higher scores, they increased their lead-to-MQL conversion rate by 18% over one quarter”.
Studies also show that leads with high open rates are 2.5 times more likely to become Marketing Qualified Leads (MQLs) compared to those with lower open rates. Tracking trends over time, rather than focusing on one-off campaigns, strengthens the connection between open rates and lead quality.
Ease of Measurement and Tracking
Open rates are one of the simplest email metrics to track. Platforms like Mailchimp, HubSpot, and Salesforce Marketing Cloud automatically measure this using tracking pixels embedded in emails. These pixels load when an email is opened, providing instant data.
However, privacy updates - like Apple Mail Privacy Protection, which can preload images - have made open rate tracking less precise. To address this, it’s better to monitor long-term trends and pair open rates with other metrics, such as click-through rates, for a more accurate picture.
Influence on Sales Readiness
A high open rate suggests that recipients are paying attention to your emails, but it’s not a definitive sign of sales readiness. Opening an email requires minimal effort compared to actions like clicking on links or downloading resources.
To gauge intent, sales teams should look for consistent patterns. Leads who regularly open emails, especially those tied to product updates or special offers, may be worth prioritizing. Repeated engagement through email opens often signals stronger interest. By combining open rate data with other behavioral insights, teams can refine lead scoring and tailor follow-ups more effectively.
3. Click-Through Rate (CTR)
CTR measures the percentage of delivered emails that result in a link click. It’s calculated using the formula: (clicks ÷ delivered emails) × 100. For example, if 200 out of 5,000 delivered emails generate clicks, the CTR would be 4%.
Building on metrics like delivery and open rates, CTR goes a step further by tracking active engagement. While an open rate shows interest, a click demonstrates intent, making CTR a key behavioral metric for evaluating lead engagement.
Impact on Lead Scoring Accuracy
CTR is a strong indicator of how engaged recipients are with your email content, making it a critical factor in lead scoring models that rely on real-time behavioral data. Leads with higher CTRs often receive more points, reflecting their likelihood to progress through the funnel.
For instance, a SaaS company assigned 20 points for clicks on a "Request a Demo" link compared to 5 points for email opens. This adjustment led to a 25% increase in qualified opportunities.
Tracking CTR accurately allows marketers to fine-tune their lead scoring models by separating genuinely interested leads from passive ones. In the U.S., B2B email campaigns typically see CTRs ranging from 2% to 5%, depending on the industry and campaign type. Using these benchmarks, businesses can set thresholds and assign higher scores to leads that exceed the average CTR.
Relevance to Engagement or Conversion
CTR is a clear measure of active engagement, showing which leads are interacting with your content rather than just skimming it. High CTRs often align with better conversion rates because engaged leads are more likely to take meaningful actions, like signing up for a demo or requesting more details. B2B campaigns with higher CTRs often generate more Marketing Qualified Leads (MQLs) and Sales Qualified Leads (SQLs).
When leads consistently click on key calls-to-action (CTAs), such as links to pricing pages or product features, it signals stronger purchase intent. Additionally, high CTRs help identify the content and messaging that resonates most with your audience. Emails with strong CTRs highlight topics that drive engagement, giving marketers valuable insights to refine future campaigns. These findings integrate seamlessly into automated tracking systems, improving lead scoring efficiency over time.
Ease of Measurement and Tracking
Most email marketing platforms provide built-in tools for tracking and reporting CTR, making it easy to monitor and analyze this metric. Marketers can access real-time CTR data, segment it by campaign, and track trends without needing manual calculations.
Platforms like Reform take this a step further by integrating CRM data and automatically updating lead scores in real time. By capturing actual clicks, these systems offer concrete behavioral data that reflects recipient interest. This automation ensures high-engagement leads are identified and routed to the right teams quickly.
Influence on Sales Readiness
Leads with high CTRs are often closer to making a purchase because their actions demonstrate genuine interest in your product or service. Sales teams can prioritize these leads, increasing the likelihood of conversion. Segmenting leads by CTR also allows you to target those clicking on key CTAs, which are strong indicators of purchase intent. For example, a lead with a CTR above 5% might be flagged for immediate follow-up, while leads with lower CTRs could benefit from further nurturing.
Regularly analyzing CTR trends and adjusting point allocations based on conversion outcomes can improve your lead scoring model. If high-CTR leads consistently convert at higher rates, their score weighting should be increased. This ongoing analysis ensures your scoring system adapts to changing engagement patterns. Up next, we’ll explore how bounce rates play a role in refining lead scoring models.
4. Click-to-Open Rate (CTOR)
CTOR represents the percentage of email recipients who clicked on a link after opening the email. You calculate it using this formula: (unique clicks ÷ unique opens) × 100. For instance, if 500 people opened your email and 100 clicked a link, your CTOR would be 20%.
Unlike CTR, which considers all recipients, CTOR zeroes in on those who actually opened the email. This makes it a sharper tool to evaluate how effective your content and calls-to-action (CTAs) are.
Impact on Lead Scoring Accuracy
CTOR plays a key role in refining lead scoring by identifying highly engaged leads, allowing marketers to assign them higher scores. For example, a B2B SaaS company used CTOR thresholds to segment leads, giving higher scores to those with a CTOR above 20%. They then followed up with personalized outreach, which led to a 30% boost in qualified opportunities and a shorter sales cycle.
Because CTOR focuses on intentional engagement - filtering out accidental opens or automated image loads - it’s a more reliable indicator of genuine interest than open rates alone.
Relevance to Engagement or Conversion
CTOR highlights the percentage of recipients who found your email engaging enough to take action, making it an excellent signal for identifying conversion-ready leads. In the U.S., typical CTOR benchmarks for B2B campaigns range from 10% to 20%. Leads that consistently surpass these benchmarks often indicate stronger purchase intent, making them a priority for sales teams.
A high CTOR confirms that your content resonates with your audience and effectively inspires action.
Ease of Measurement and Tracking
Tracking CTOR is straightforward, thanks to modern email marketing platforms that include it in campaign reports by default. These tools eliminate the need for manual calculations and allow marketers to segment leads based on CTOR performance. Platforms like Reform even offer real-time analytics and integrations, ensuring lead scores are updated instantly to spotlight engaged prospects.
Influence on Sales Readiness
A strong CTOR suggests that a lead is not just opening emails but actively engaging with the content, signaling a higher level of interest and potential readiness for sales outreach. Incorporating CTOR into lead scoring helps sales teams focus on leads more likely to convert, boosting both conversion rates and overall efficiency. For example, leads clicking on product demo links may be ready for a detailed conversation, while those engaging with pricing information might be closer to making a purchase decision.
However, keep in mind that factors like email rendering issues, bot clicks, or misleading subject lines can distort CTOR data. To address these challenges, combine CTOR with other engagement metrics and regularly review your scoring models to maintain accuracy. By integrating CTOR insights into your lead scoring strategy, you can sharpen your sales focus and streamline follow-up efforts effectively.
5. Conversion Rate
Conversion rate is a key metric that shows the percentage of email recipients who complete a meaningful action - like filling out a form, requesting a demo, or making a purchase - after interacting with an email. The formula is straightforward: (number of conversions ÷ total number of delivered emails) × 100. For example, if you send 1,000 emails and 80 people take the desired action, your conversion rate would be 8%.
This metric goes beyond tracking clicks or opens, as it directly measures intent to act. In the U.S., the average email marketing conversion rate is around 15.22%. For B2B campaigns, rates typically fall between 5–8%, while e-commerce campaigns often see higher rates, ranging from 15–20%.
Impact on Lead Scoring Accuracy
Conversion rates play a critical role in validating your lead scoring model. If high-scoring leads consistently convert at better rates, it’s a clear sign your model is effective. On the flip side, if these leads rarely convert, it may be time to adjust the model to better reflect behaviors that truly predict intent. According to Salesforce, leads with higher conversion rates are three times more likely to become sales-qualified leads. By analyzing conversion rates across various lead score brackets, you can fine-tune your scoring model for greater accuracy.
Relevance to Engagement or Conversion
While engagement metrics like clicks and opens are useful, conversion rate offers deeper insight into genuine intent. A recipient might click on multiple links in an email, but the conversion rate reveals whether they’re taking the next step toward becoming a customer. This distinction is crucial for separating casual browsers from serious prospects, ensuring your sales efforts are directed where they’ll have the most impact.
Ease of Measurement and Tracking
Thanks to modern tools, tracking conversion rates has never been easier. Most email marketing and CRM platforms come equipped with built-in tracking features for conversion events. These tools allow you to set specific goals - such as form submissions, demo requests, or purchases - and automatically calculate conversion rates. Platforms like Reform even include conversion-optimized forms and real-time analytics to provide high-quality data that feeds directly into your lead scoring system. Additionally, A/B testing options allow you to continually refine your campaigns and improve conversion rates.
Influence on Sales Readiness
A strong conversion rate is a clear indicator that leads are not just engaged but are also ready to move further down the sales funnel. Actions like demo requests, pricing inquiries, or free trial signups often signal higher sales readiness and should result in higher scores. However, it’s important to avoid misattributing conversions or treating all actions equally. Using multi-touch attribution models and distinguishing between types of conversions ensures your sales team focuses on the most promising leads as we delve into the impact of negative engagement signals.
6. Bounce Rate
Bounce rate refers to the percentage of emails that fail to reach recipients' inboxes due to being returned by the server. It’s calculated using this formula: (number of bounced emails ÷ total number of emails sent) × 100. For instance, if you send 1,000 emails and 80 of them bounce, your bounce rate would be 8%.
There are two key types of bounces to know about:
- Hard bounces: These are permanent delivery failures caused by issues like invalid email addresses, closed accounts, or non-existent domains.
- Soft bounces: These are temporary issues, such as full inboxes, server problems, or emails that exceed size limits.
In the U.S., a bounce rate below 2% is considered healthy. Anything above that may point to problems with data quality.
Impact on Lead Scoring Accuracy
A high bounce rate can throw off your lead scoring model. It suggests that parts of your contact database include unreachable or invalid email addresses. If your scoring system assigns points to these leads, you’re essentially wasting time on contacts who will never engage. Real-time email verification can help solve this. For example, a B2B SaaS company reduced their bounce rate from 8% to 2% by regularly cleaning their email lists and validating addresses. This not only improved engagement metrics but also boosted qualified opportunities by 15% while shortening their sales cycle.
Relevance to Engagement or Conversion
Invalid email addresses don’t just block engagement - they distort your metrics. High bounce rates can artificially inflate stats like open and click-through rates, making it difficult to identify which leads are genuinely engaged. This can lead to poor marketing decisions based on unreliable data.
Ease of Measurement and Tracking
Most email marketing platforms make tracking bounce rates simple. They typically provide detailed bounce statistics for each campaign, breaking them down into hard and soft bounces. This helps marketers take the right steps, like immediately removing hard bounce contacts and addressing soft bounces by retrying or investigating the issue. These insights are invaluable for keeping lead scoring systems accurate and focused on active, reachable contacts.
Influence on Sales Readiness
Leads tied to bounced emails are not sales-ready because they can’t be reached through email, a critical channel for nurturing and outreach. High bounce rates often highlight outdated or low-quality leads that need to be deprioritized. Make sure to flag leads with hard bounces or repeated soft bounces to focus your sales and marketing efforts on contacts who are reachable and likely to engage.
sbb-itb-5f36581
7. Unsubscribe Rate
The unsubscribe rate tells you the percentage of people who opt out after receiving your email campaign. The formula is straightforward: (number of unsubscribes ÷ number of emails delivered) × 100. For example, if 10 people unsubscribe out of 1,000 delivered emails, the unsubscribe rate is 1%.
In the U.S., the average unsubscribe rate for B2B email campaigns typically falls between 0.2% and 0.5%. If your rate exceeds 1%, it could point to issues with your targeting or content strategy.
Impact on Lead Scoring Accuracy
A high unsubscribe rate is a clear sign of disengagement, and when used effectively, it can improve the accuracy of your lead scoring model. Unsubscribing signals a lack of interest, so these leads are less likely to respond positively to sales outreach.
Adding unsubscribe data to your lead scoring system helps you focus on prospects who are genuinely interested. For instance, a B2B SaaS company noticed a spike in unsubscribes after a promotional email series. By assigning negative points to those who opted out, they refined their lead scoring model. This adjustment led to better prioritization and a higher conversion rate among the remaining leads. Metrics like this help fine-tune your approach to lead prioritization.
Relevance to Engagement or Conversion
Unsubscribes are the opposite of engagement. They’re a clear signal that your content isn’t resonating with your audience. Leads who unsubscribe are far less likely to convert, making this metric essential for identifying weak spots in your campaigns or messaging.
If you notice a rising unsubscribe rate, it’s a cue to reassess the relevance of your content and the frequency of your emails. This metric doesn’t just highlight who’s engaging - it also reveals who’s actively tuning out your brand.
Ease of Measurement and Tracking
Most email marketing platforms make it easy to track unsubscribe rates, displaying them directly in campaign analytics dashboards. This allows you to monitor trends over time and across different audience segments without much effort.
CRM systems often integrate with email platforms, updating lead scores in real time when someone unsubscribes. For example, Reform’s analytics and CRM integrations allow businesses to automatically adjust lead scores based on unsubscribe events, ensuring your scoring model reflects the latest engagement trends.
Influence on Sales Readiness
Leads who unsubscribe are clearly not ready for sales outreach and should be deprioritized. A high unsubscribe rate within a specific segment suggests it’s time to remove those contacts from active campaigns. On the other hand, low unsubscribe rates can indicate a more engaged audience, potentially ready for direct sales efforts.
To make the most of this data, lead scoring models should deduct points for unsubscribes. This ensures sales teams focus their energy on prospects who are still open to communication and more likely to move through the sales funnel.
8. Spam Complaint Rate
The spam complaint rate is calculated using the formula: (spam complaints ÷ delivered emails) × 100. For instance, if 5 recipients mark your email as spam out of 10,000 delivered emails, your spam complaint rate would be 0.05%.
In the U.S., it’s recommended to keep this rate below 0.1%, which equates to no more than 1 complaint per 1,000 emails sent. Crossing this threshold can lead to serious consequences like deliverability problems, blacklisting, or even suspension of your email account.
Impact on Lead Scoring Accuracy
Spam complaints are one of the clearest indicators of negative engagement in email campaigns. When recipients flag your emails as spam, it’s a sign that your content is either irrelevant or unwanted. This often points to issues in targeting or the quality of your leads. Incorporating spam complaint data into your lead scoring system is essential for filtering out disengaged or problematic leads.
For example, a high spam complaint rate might indicate that your database contains fake or low-quality leads, which can distort your scoring model. Most lead scoring systems assign a steep negative score - frequently -50 points or more - to leads with spam complaints. This immediately downgrades their score and removes them from the sales-ready category, ensuring your team focuses on genuine prospects.
Relevance to Engagement or Conversion
Spam complaints are an even stronger negative signal than unsubscribes. They reflect active dissatisfaction, making it clear that these leads are unlikely to convert. Beyond individual leads, high complaint rates can damage your sender reputation, which could harm deliverability for your entire email list. Tracking this metric also helps you identify campaigns or audience segments that aren’t resonating, signaling when adjustments to your messaging or targeting might be needed.
Ease of Measurement and Tracking
Most email service providers and marketing automation platforms automatically monitor spam complaints and display this data in campaign analytics dashboards. You can also set up alerts to notify you of sudden spikes in complaint rates. By integrating spam complaint data into your lead scoring system, you can work with real-time updates. For example, Reform's analytics and email validation tools can help prevent fake leads from entering your database, ensuring you’re only working with genuine prospects.
Influence on Sales Readiness
Leads that generate spam complaints are not sales-ready and should be deprioritized immediately. High complaint rates often signal a mismatch between your offerings and the lead’s interests or issues with list hygiene. Factoring spam complaints into your lead scoring ensures your sales team focuses on high-quality leads, improving both efficiency and conversion rates. A spam complaint should outweigh any prior positive interactions, as it’s a definitive sign of the lead’s negative sentiment toward your brand.
| Metric | Industry Best Practice | Impact on Lead Scoring | Action Required |
|---|---|---|---|
| Spam Complaint Rate | < 0.1% | Strong negative score | Suppress/remove flagged leads |
9. Email Engagement Scoring
Email engagement scoring combines several key metrics into a single, weighted score, offering a clear snapshot of a lead's overall interest. By assigning point values to specific actions - like 5 points for opening an email, 10 for clicking a link, and 20 for completing a form - it creates a cumulative score that reflects the quality and readiness of a lead.
Impact on Lead Scoring Accuracy and Conversion Relevance
Incorporating real-time behavioral data into your scoring process can significantly enhance lead scoring accuracy. Unlike static demographic data, engagement metrics reveal how actively leads are interacting with your content. For example, HubSpot's 2023 report found that businesses utilizing engagement-based scoring saw conversion rates jump from 7.2% to 12.8% in just 90 days. This increase highlights how dynamic scoring improves lead prioritization and focuses efforts on the most promising opportunities.
Engagement scoring is particularly effective because it tracks the entire lead journey - from initial interactions to deeper engagement and conversion. Metrics like open rates, click-through rates, and form completions provide actionable insights. For instance, a B2B SaaS company that automated its lead scoring process saw its Sales Qualified Lead (SQL) conversion rate rise from 15% to 25%. They also experienced a 40% boost in qualified opportunities after reducing response times from 24 hours to under 5 minutes. These results underscore the power of using engagement data to refine lead prioritization.
This approach becomes even more valuable when it maps a lead's progression through the engagement funnel. A lead that regularly opens emails, clicks on product links, and downloads resources demonstrates a clear pattern of interest and readiness - often more predictive of conversion than demographic data alone. This dynamic scoring system helps align sales efforts with leads most likely to convert.
Ease of Measurement and Tracking
Modern email and CRM tools make tracking engagement metrics straightforward. Platforms automatically log opens, clicks, and conversions in real-time dashboards. By integrating your email marketing software with your CRM, you can automate lead score updates based on these metrics without manual intervention. Tools like Reform seamlessly sync CRM data, simplifying the inclusion of engagement metrics in your scoring process.
To maintain accuracy, it’s essential to regularly review and adjust scoring rules. Buyer behaviors evolve over time, so ensuring that high engagement scores remain aligned with actual sales outcomes is key to long-term success.
Influence on Sales Readiness
High engagement scores often signal that a lead is primed for sales outreach. Leads who consistently open emails, click links, and complete conversions are more likely to respond positively to sales efforts. This allows sales teams to focus on prospects who are already engaging with your content, improving efficiency and boosting win rates. The table below outlines how different engagement actions translate into sales readiness:
| Engagement Action | Point Value | Sales Readiness Indicator |
|---|---|---|
| Email Open | 5 points | Shows initial interest |
| Link Click | 10 points | Indicates active engagement |
| Form Completion | 20 points | Signals high intent |
| Email Reply | 25 points | Suggests readiness for contact |
10. Matching Metrics to Scoring Goals
Aligning email metrics with lead scoring goals means connecting specific data points to conversion objectives. By tying metrics directly to scoring strategies, you refine how leads are evaluated. The focus should be on selecting metrics that not only predict conversions but can also be tracked in real time. This approach ensures that every engagement signal provides actionable insights for your sales team.
Impact on Lead Scoring Accuracy
Each metric plays a unique role in improving lead scoring accuracy. For instance, open rates give a basic sense of interest, while click-through rates show a deeper level of interaction. However, conversion rates are the most reliable indicators since they directly measure the actions you want leads to take.
This highlights the importance of using the right metrics to pinpoint sales-ready leads. Companies using predictive lead scoring models that adapt metrics based on conversion likelihood report much higher success rates compared to those sticking with static methods. The best models combine explicit data, like job titles or company size, with implicit data, such as email engagement or website behavior patterns.
Relevance to Engagement or Conversion
The metrics you prioritize should depend on whether you're focused on nurturing early engagement or driving immediate conversions. For example, early engagement metrics like open rates are useful for gauging initial interest, while conversion-focused metrics, such as click-to-open rates and form completions, offer stronger predictive value for sales readiness.
HubSpot's 2023 research found that aligning engagement-based scoring with sales readiness increased conversion rates from 7.2% to 12.8% in just 90 days. This success came from prioritizing specific engagement behaviors instead of treating all interactions the same.
Top-performing organizations use a tiered scoring system, assigning different weights to metrics based on their connection to actual sales outcomes. For instance, email replies and demo requests often carry more weight than opens or clicks because they signal a higher likelihood of purchase.
Ease of Measurement and Tracking
Platforms like Reform simplify tracking and analyzing engagement metrics, offering real-time analytics that help adjust scoring models and enable faster follow-ups with promising leads. While some metrics, like overall engagement scores, might require additional setup, they often provide deeper insights.
The key is balancing the complexity of measurement with the value it brings to your scoring system. Real-time tracking helps determine when and how to act on high-potential leads, ensuring your scoring model stays aligned with sales goals.
Influence on Sales Readiness
Metrics like click-to-open rates and conversion rates are among the strongest indicators of sales readiness. They reflect consistent interest and actionable behavior. Leads who frequently interact with emails and complete desired actions are more likely to be ready for direct sales outreach.
For example, a B2B SaaS company increased its Sales Qualified Lead conversion rate from 15% to 25% by automating lead scoring and reducing response times. This led to a 40% boost in qualified opportunities. Their success came from linking high-engagement metrics directly to sales triggers.
Many lead scoring models use a 0-to-100 point system, where higher scores signal greater sales readiness. Regularly reviewing and updating these metrics ensures they stay relevant to current buyer behaviors and business goals. Feedback from the sales team is also crucial for fine-tuning scoring criteria, especially when high-scoring leads fail to convert as expected. This continuous adjustment ensures that measured engagement consistently translates into targeted sales efforts.
| Metric Category | Best Use Case | Scoring Weight | Sales Action Trigger |
|---|---|---|---|
| Email Opens | Early engagement tracking | Low (1-5 points) | Add to nurture sequence |
| Link Clicks | Active interest measurement | Medium (5-15 points) | Send targeted content |
| Form Completions | High-intent identification | High (15-25 points) | Direct sales outreach |
| Email Replies | Immediate sales readiness | Very High (20-30 points) | Priority sales contact |
Metric Comparison Table
This table breaks down the role, importance, and scoring weight of various email metrics in lead scoring.
| Email Metric | Metric Type | Typical Scoring Weight | Impact Level on Lead Qualification | Primary Use Case |
|---|---|---|---|---|
| Delivery Rate | Deliverability | 5 points | Low (Foundational) | Validates data quality |
| Open Rate | Engagement | 5–10 points | Medium | Tracks initial interest |
| Click-Through Rate (CTR) | Engagement | 15–20 points | High | Measures active engagement |
| Click-to-Open Rate (CTOR) | Engagement | 10–15 points | High | Assesses content relevance |
| Conversion Rate | Outcome/Intent | 25–30 points | Very High | Indicates sales readiness |
| Bounce Rate | Deliverability | -10 to -15 points | High (Negative) | Monitors list quality |
| Unsubscribe Rate | Disengagement | -10 to -15 points | Medium (Negative) | Signals declining interest |
| Spam Complaint Rate | Disengagement | -20 to -25 points | High (Negative) | Highlights content or frequency issues |
| Email Engagement Score | Composite | 20–25 points | Very High | Provides overall engagement insights |
Each metric plays a distinct role in shaping lead qualification strategies. Engagement metrics like CTR and conversion rate are key indicators of a lead's quality and readiness, while deliverability metrics like delivery and bounce rates ensure the health of your email list. Negative signals, such as unsubscribes and spam complaints, highlight disengagement or potential flaws in content or frequency.
Composite metrics, such as the Email Engagement Score, combine multiple data points to give a comprehensive view of lead quality and evolving engagement trends. By leveraging Reform's analytics, you can seamlessly turn these metrics into actionable lead scoring adjustments.
Here’s how you can use these scoring weights effectively:
- High scores: Indicate sales readiness and should prompt immediate action from your sales team.
- Moderate scores: Suggest leads that require nurturing to move further down the funnel.
- Low or negative scores: Call for re-engagement campaigns or, in some cases, removal from the list.
Reform’s real-time analytics ensure your lead scores are always up to date, helping your sales team stay focused on the most promising opportunities.
Conclusion
Email metrics are the backbone of creating precise lead scoring models that translate into real sales performance. They provide a structured way to assess lead quality, from initial engagement all the way to showing intent to buy.
The numbers speak for themselves: businesses that leverage detailed lead scoring based on email engagement see a 43% boost in sales-accepted leads and enjoy 22% shorter sales cycles. Considering that 96% of website visitors aren’t ready to make a purchase and only 20% of converted leads result in closed deals, focusing on the right prospects is critical for streamlining sales efforts. These stats highlight just how vital robust email metrics are for an effective lead scoring strategy.
Reform’s suite of tools - real-time analytics, email validation, and CRM integrations - simplifies implementing these metrics and enriches lead data. By breaking down data silos, it ensures your scoring remains accurate and actionable.
Ongoing optimization, driven by collaboration between marketing and sales teams, can increase sales-ready leads by 50% while cutting costs by 33%. But this requires aligning scoring criteria with genuine buyer behavior, not just surface-level activity.
To make the most of your efforts, focus on metrics that support your specific goals. Want more qualified leads? Prioritize click-through and conversion rates. Concerned about churn? Pay close attention to unsubscribe and spam complaint rates. Companies that fine-tune their lead scoring see a 77% improvement in lead generation ROI, proving the impact of aligning email metrics with both marketing and sales priorities.
Regular reviews, A/B testing, and ongoing adjustments using Reform’s analytics help keep your lead scoring accurate and your sales team focused on the most promising opportunities. By treating lead scoring as a living, evolving process, you’ll turn it into a powerful tool that delivers measurable sales results.
FAQs
Why are email metrics like open rates and click-through rates important for lead scoring?
Email metrics like open rates and click-through rates offer a clear window into how leads are engaging with your content. They act as a barometer for measuring interest and interaction with your brand.
For instance, if your open rates are high, it suggests your subject lines are grabbing attention. On the other hand, strong click-through rates show that recipients are not just opening your emails - they’re actively engaging by clicking links to learn more about your offerings. Incorporating these metrics into your lead scoring model can help you pinpoint the most promising leads and focus your follow-up efforts on those who are more likely to convert.
What are the best practices for ensuring high email delivery rates?
Maintaining a strong email delivery rate is crucial for successful email marketing. Here are some practical tips to help ensure your messages land in your recipients' inboxes:
- Authenticate your domain: Set up SPF, DKIM, and DMARC protocols to show email providers that your messages are trustworthy.
- Keep your email list updated: Regularly clean your list by removing invalid, inactive, or unresponsive email addresses to minimize bounce rates.
- Write professional content: Steer clear of spammy language, excessive capitalization, unnecessary symbols, or misleading subject lines to avoid spam filters.
- Track engagement: Pay attention to open rates and click-through rates, and focus on sending content that’s relevant and personalized to your audience.
These steps can help you build a solid sender reputation and achieve better delivery rates for your email campaigns.
How can businesses use conversion rates to enhance lead scoring and boost sales?
Conversion rates are a key factor in sharpening lead scoring models and crafting more effective sales strategies. By analyzing how prospects move through each stage of the sales funnel, businesses can identify their most promising leads and fine-tune their outreach efforts.
With tools like Reform, companies can design tailored, conversion-driven forms that enhance lead quality. Features like multi-step forms, conditional routing, real-time analytics, and email validation ensure that only the most relevant and engaged leads are captured. This makes it simpler to prioritize those leads and nurture them with precision.
Related Blog Posts
Get new content delivered straight to your inbox

The Response
Updates on the Reform platform, insights on optimizing conversion rates, and tips to craft forms that convert.


Drive real results with form optimizations
Tested across hundreds of experiments, our strategies deliver a 215% lift in qualified leads for B2B and SaaS companies.
