
.webp)
How To Measure Form Drop-Off Rates With Analytics


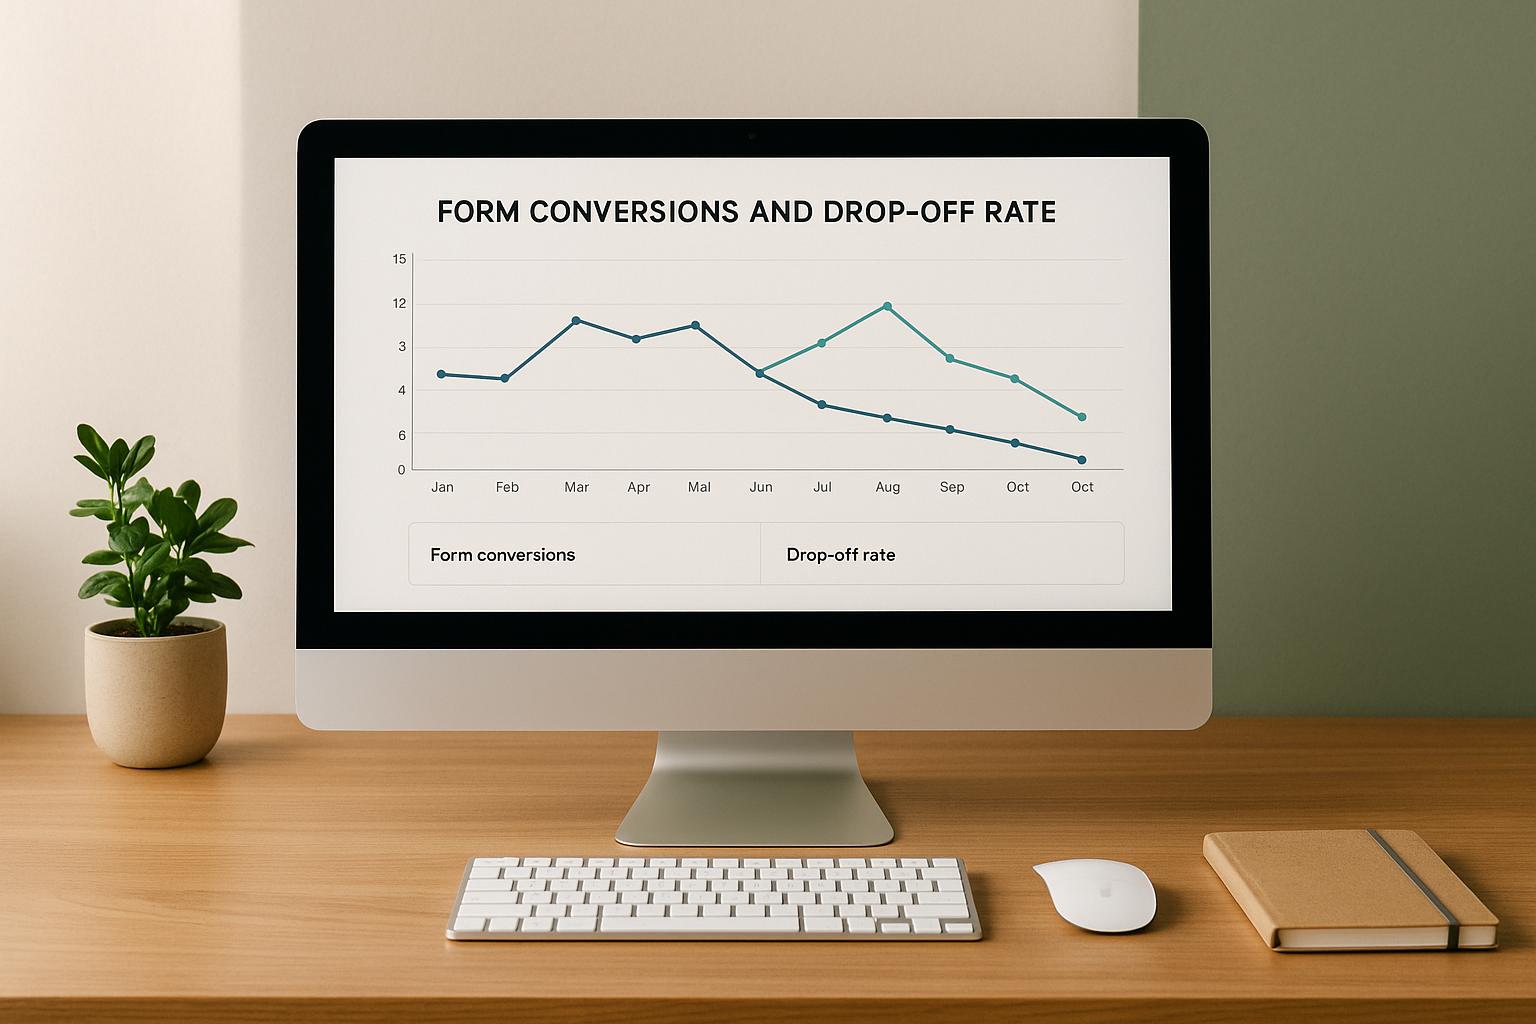
Every abandoned form equals lost opportunity. Form drop-off rates show where users leave forms unfinished, helping you fix issues and boost conversions. Here's what you need to know:
- Drop-off rate formula: (Abandonments ÷ Form starts) × 100.
- Key metrics to track: Field drop-offs, hesitation time, refill rates, device-specific issues, and error rates.
- Tools to use: Analytics platforms like Reform for real-time tracking, field-level insights, and A/B testing.
- Fix common problems: Simplify forms, reduce unnecessary fields, optimize for mobile, and use progress indicators.
What Are Form Drop-Off Rates
Form Drop-Off Rate Definition
Form drop-off rate refers to the percentage of users who start filling out a form but leave it incomplete. You can calculate it using this formula:
(Number of abandonments ÷ Number of form starts) × 100.
While it’s often confused with the term "abandonment rate", some analytics tools make a distinction. "Abandonment" might refer to users leaving the entire page, whereas "drop-off" specifically focuses on users disengaging from the form itself.
Drop-off rates can be analyzed on different levels. You can track the overall drop-off rate for the entire form or dig deeper to identify field-level drop-offs, which highlight specific points where users tend to leave. For instance, a field requiring detailed information might see more drop-offs compared to simpler fields.
Timing also plays a role. Immediate drop-off happens when users view the form but don’t interact with it, while progressive drop-off occurs when users abandon the form partway through. Knowing whether users leave right away or after starting helps pinpoint whether the problem lies in the form's initial design or its flow.
These insights provide a foundation for understanding why monitoring drop-off rates is so important.
Why You Need to Track Drop-Off Rates
Tracking drop-off rates helps identify where users encounter issues and why they leave your forms unfinished. For example, even if your submission rate looks decent, a deeper dive might reveal that most users who reach the final step complete the form - indicating that early steps are causing the drop-offs.
This data is directly tied to improving conversion rates. Small tweaks to reduce drop-offs can lead to big gains, especially for forms with high traffic. If users consistently abandon a specific field, targeted adjustments to that field are often more effective than overhauling the entire form.
Drop-off insights also help focus your optimization efforts. Instead of redesigning the form entirely, you might find that simplifying or repositioning a single problematic field reduces abandonment significantly. This saves time, effort, and resources while delivering noticeable results.
Segmenting drop-off data by factors like traffic source, device type, or user demographics adds even more value. For instance, mobile users might struggle with certain fields that desktop users don’t, or visitors from social media might behave differently than those from search engines. These details allow you to fine-tune your form design to better suit your audience's needs.
Real-time tracking adds another layer of effectiveness. With tools like Reform’s real-time analytics, you can monitor form performance as it happens, quickly spot spikes in abandonment, and address issues before they hurt your conversion rates.
Important Metrics to Track
Main Metrics to Watch
Tracking the right metrics can make all the difference when it comes to improving form performance. Here are some key ones to keep an eye on:
- Drop-off rate by field: This measures how often users abandon a form at specific fields. If one field has a higher drop-off rate than others, it could point to confusing design or unclear instructions.
- Hesitation time: This metric tracks how long users pause at each field. Longer pauses might indicate uncertainty or confusion, suggesting the need for simpler instructions or a more intuitive layout.
- Refill rates: This shows how often users delete and re-enter information in a field. High refill rates usually mean the field's labels or validation rules aren't clear enough.
- Time spent per field: This reveals how much time users spend on individual fields. If users are spending too long on simple fields, it’s a sign that something might be off and needs attention.
- Completion rate by traffic source: This compares how well your form performs across different audience groups. For example, are users from email campaigns completing forms more often than those from social media? This insight can help fine-tune your outreach strategies.
- Device-specific drop-off rates: This metric highlights usability issues tied to specific devices. If mobile users are dropping off more frequently than desktop users, it’s a clear sign that your form needs better mobile optimization.
- Error rate by field: This tracks how often users encounter validation errors. A high error rate for a particular field might mean the requirements are too strict or unclear, offering a chance to improve the user experience.
By understanding these metrics, you can identify problem areas and take immediate action to improve your forms.
How Real-Time Analytics Help
Metrics are even more powerful when paired with real-time analytics. With real-time insights, you can respond to issues as they happen instead of waiting for post-event reviews.
For example, during high-traffic periods - like a marketing campaign or a viral social media post - traffic spike management becomes crucial. Real-time analytics let you see if your form is struggling to handle the load, so you can tackle performance problems on the spot.
Reform’s real-time analytics dashboard provides a live view of how users interact with your form. You can watch in real time as users progress, identify where they’re getting stuck, and spot emerging patterns. This instant feedback loop allows for quick adjustments to improve usability and reduce abandonment rates.
Additionally, continuous monitoring can uncover time-based trends, such as users abandoning forms at certain times of the day. Armed with this knowledge, you can make targeted tweaks to better align with user behavior.
Typeform Community Workshop: How to track form drop-offs and boost completion rates

How to Set Up Analytics for Drop-Off Tracking
To effectively track drop-offs in your forms, you need to configure analytics to monitor key user interactions throughout the entire form journey. This setup builds on the metrics discussed earlier, ensuring that every significant interaction is captured and analyzed.
Setting Up Event Tracking
Event tracking is at the heart of understanding where users drop off. It involves identifying critical moments in the user journey and collecting data that helps you make informed decisions.
Start by recording when users first view your form. Capture details like the timestamp, source, and device type. This establishes a baseline for calculating drop-off rates and gives you a clear picture of your total audience.
Track user engagement by monitoring clicks, typing activity, and field changes. This data reveals which fields users interact with the most and where they may hesitate or spend extra time. Be sure to log both successful field completions and cases where users click into a field but leave it empty.
Pay attention to errors. Track the fields where errors occur, the type of error, and whether it gets resolved. This information helps pinpoint form elements that might need improvement.
Finally, monitor when users leave the page, close the tab, or become inactive. Data like session duration and the last field interacted with can provide insights into abandonment patterns.
Tracking Drop-Offs by Form Fields
Field-level tracking offers detailed insights into exactly where users abandon your forms. By setting up individual tracking points for each field, you can create a detailed map of user behavior.
Log entry and exit events for every field to understand completion rates and identify problem areas. For multi-step forms, track user progress between sections. Record when users move to the next step and when they abandon the form, noting the step number and section name for context.
If your form includes conditional logic - fields that appear based on user responses - track when these fields appear and whether they are completed. This data helps identify if dynamic elements are causing friction.
For forms with file upload features, monitor upload attempts, successful uploads, and abandonments related to file uploads. This can uncover opportunities to improve the user experience in this area.
These granular tracking methods lay the groundwork for leveraging Reform's real-time analytics.
Using Reform's Real-Time Analytics
Once your tracking setup is in place, Reform's real-time analytics can take your data collection and analysis to the next level. The platform simplifies the process, automatically capturing drop-off metrics without requiring complex configurations, making it accessible even for non-technical teams.
Reform's real-time dashboard provides a live view of form activity, showing you current users, field interactions, and completion rates as they happen. This allows you to quickly identify and address issues during high-traffic periods. The dashboard updates every few seconds, offering an up-to-date snapshot of form performance.
Field-level analytics are handled automatically by Reform, which tracks user interactions with each form element. Completion rates and error frequencies are presented in an intuitive interface, eliminating the need for manual tracking setup. This ensures you never miss critical data points.
The platform also includes an abandoned submission tracking feature. Even if users don't complete the form, Reform captures partial data, giving you insights into user intent. This information can be securely stored and integrated with your CRM or email marketing tools, enabling automated follow-ups with interested users.
Reform's integration capabilities allow it to work seamlessly with tools like Google Analytics, marketing automation platforms, and CRM systems. This ensures your form analytics are part of your broader marketing strategy, eliminating data silos and providing a complete view of your conversion funnel.
Additionally, Reform supports A/B testing for form optimization. The platform randomly assigns users to different versions of your form and tracks metrics like completion rates, drop-off points, and conversion quality. This feature simplifies testing and helps you confidently implement improvements to your forms.
sbb-itb-5f36581
How to Calculate and Read Drop-Off Rates
Turning raw analytics into actionable insights is key to improving your forms. Knowing how to calculate drop-off rates and interpret the data can help you pinpoint exactly where potential leads are slipping away.
Drop-Off Rate Calculation
The formula for calculating drop-off rates is simple: (Number of users who started but didn’t complete the form / Total users who started) × 100%. This percentage shows how many users abandon your form before finishing it.
Let’s break it down with an example: If 1,000 users start your form but only 350 complete it, the drop-off rate is (650 ÷ 1,000) × 100% = 65%. That means nearly two-thirds of your potential leads didn’t make it to the end.
But there’s more to the story than just the overall drop-off rate. Field-level drop-off rates can give you deeper insights. For instance, if 800 users reach your phone number field but only 600 fill it out, that specific field has a 25% drop-off rate.
For multi-step forms, analyzing drop-offs at each step is crucial. If completion rates drop from 85% on step one to 45% on step three, you’ve identified a problem area.
Time-based metrics can also shed light on user behavior. If users spend over 30 seconds on a single field, it might indicate confusion or difficulty. Monitoring how long users take on each field and how many exceed typical completion times can help you identify bottlenecks.
Once you’ve crunched the numbers, the next step is understanding what they reveal about user behavior.
What Your Drop-Off Data Means
Interpreting drop-off data can uncover specific usability issues and opportunities for improvement. For example, drop-off rates over 70% often point to major usability problems. Rates between 40-60% are more common for longer forms but still signal room for improvement.
Field-specific patterns offer valuable clues. High drop-off rates in email fields might indicate issues with validation or fears about spam. Phone number fields are another common sticking point, especially when marked as required. Address fields can also cause frustration due to their length or complexity.
Device-based trends are another factor to consider. Mobile users often show 15-25% higher drop-off rates than desktop users, especially on forms with many fields or complex layouts. If your mobile drop-off rate is more than 30% higher than your desktop rate, it’s likely your form isn’t mobile-friendly.
Traffic source analysis can reveal how user intent varies. Organic search traffic often has lower drop-off rates, suggesting users are more engaged. On the other hand, social media traffic tends to have higher drop-off rates, as users may be casually browsing rather than actively looking for your product or service.
Timing matters too. B2B forms may see fewer completions on weekends, while consumer forms might perform better during those same days. Seasonal trends, holidays, and even time of day can all influence drop-off rates.
Using Tables to Compare Data
Organizing your drop-off data into tables can make patterns and priorities much clearer. For example, a field comparison table helps you identify which parts of your form need the most attention:
| Form Field | Users Reached | Users Completed | Drop-Off Rate | Priority |
|---|---|---|---|---|
| Email Address | 1,000 | 920 | 8% | Low |
| Phone Number | 920 | 650 | 29% | High |
| Company Size | 650 | 580 | 11% | Medium |
| Budget Range | 580 | 420 | 28% | High |
| Comments | 420 | 350 | 17% | Medium |
This table highlights that the phone number and budget range fields need urgent attention to reduce abandonment.
Device and traffic source comparisons can also guide your optimization efforts. For example, if desktop users complete forms at a rate of 45% but mobile users only achieve 25%, it’s clear that improving the mobile experience could significantly boost your overall conversions.
Time-period comparisons allow you to track progress and spot trends. For instance, if your drop-off rate decreases from 65% to 45% over three months, it’s a strong indicator that your adjustments are working.
If manual calculations seem daunting, tools like Reform’s analytics dashboard can simplify the process. The platform automatically generates comparison tables and updates data in real time, making it easier to identify trends and refine your forms for better results.
How to Fix Forms and Reduce Drop-Offs
Pinpoint where users abandon your forms and address those issues to create a smoother experience.
Smarter Form Design
Streamline your forms by focusing on simplicity. If certain fields, like a phone number, seem to cause users to drop off, consider making them optional or moving them to a less prominent position.
Break up lengthy forms into multiple steps. Showing users their progress can make the process feel less overwhelming and reduce the chance they'll abandon it midway.
Use clear, straightforward labels and instructions. For example, instead of something like "Enterprise Solution Requirements", try something more user-friendly like "What type of help do you need?"
Eliminate unnecessary fields. Each extra field increases the likelihood of abandonment. Ask yourself if you really need details like company size or budget upfront, or if they can be collected later.
Don’t forget mobile users. Design forms that are easy to navigate on a phone, with thumb-friendly field sizes and appropriate input types, like numeric keyboards for number fields.
While design improvements are key, certain tools can take optimization even further.
Leveraging Reform's Features to Improve Forms
Conditional routing keeps forms relevant by tailoring questions based on user responses. For instance, if someone selects "Individual" instead of "Business", you can skip irrelevant questions, making the form feel shorter and more personalized.
Real-time validation alerts users immediately if they’ve made a formatting error, like entering an invalid email address. This saves time and prevents frustration.
Lead enrichment allows you to ask for just the basics, like an email address, while automatically pulling additional details - such as company name, job title, or location - in the background. This keeps the form short without missing out on key information.
Multi-step forms with progress indicators reassure users by showing how far along they are, encouraging them to stick with it. Behind the scenes, features like spam prevention and email validation ensure the leads you collect are genuine, without adding extra steps for users.
Save draft functionality is a lifesaver for longer or more complex forms, letting users pause and return later to finish.
Adapting Based on Data Insights
Regularly review your form analytics to identify patterns or spikes that could signal technical issues or shifts in user behavior.
Experiment with A/B testing to see what works best. Try variations like shorter forms, rearranged fields, or different button text. Reform’s built-in testing tools make it easy to compare results and figure out what drives the most completions.
Take an iterative approach. Tweak one element at a time - whether it’s removing a field, rephrasing instructions, or altering the layout - and measure the impact. This step-by-step method makes it easier to see what’s working.
Monitor changes over time. Even small adjustments can lead to noticeable improvements in completion rates.
Keep an eye on seasonal trends. For example, B2B forms might need adjustments during the holidays when decision-makers are harder to reach, while consumer forms may perform differently during busy shopping seasons.
Conclusion: Better Forms Lead to More Conversions
Understanding where and why users abandon your forms can unlock valuable opportunities for improvement. Tracking form drop-off rates provides a clear view of user behavior, helping you pinpoint issues that might be driving potential leads away. Whether it’s a confusing field, a technical hiccup, or asking for too much information, these insights let you address the pain points that impact your results.
The key is turning these insights into action. Simplify your forms by cutting out unnecessary fields, ensure they're mobile-friendly, and consider adding features like multi-step forms with progress indicators to keep users engaged. Conditional routing can also make the process feel more personalized, while tools like lead enrichment help you gather detailed information without overwhelming your audience. Regularly reviewing and refining your forms ensures they stay effective as user preferences evolve.
Form optimization isn’t a one-and-done task - it’s an ongoing process. By consistently analyzing performance and making adjustments, you’ll create forms that not only convert more visitors but also attract higher-quality leads. The equation is simple: better forms mean more conversions, stronger leads, and ultimately, greater revenue. This continuous improvement approach is a cornerstone of any successful digital growth strategy.
FAQs
How can I identify which fields in my form are causing users to drop off the most?
To identify which form fields are causing users to abandon the process, start by setting up a funnel analysis in your analytics tool. This will allow you to monitor how users move through each step of the form and reveal the stages where the most drop-offs happen.
Once you've mapped the funnel, dive into the performance data for each individual field. Pay close attention to fields with unusually high abandonment rates - these might be too complicated, confusing, or not essential. Simplifying or clarifying these fields can make a big difference, improving completion rates and creating a smoother experience for users.
How can I optimize my forms for mobile users to reduce drop-off rates?
To minimize drop-off rates on mobile forms, focus on keeping the design clean and easy to use. Stick to the essentials by limiting the number of fields, and make sure buttons are large enough to tap without frustration. An intuitive layout that works well on smaller screens is key. Adding clear labels and enabling autofill options can also speed up the process and make it smoother for users.
Equally important is ensuring quick load times and compatibility across various devices and browsers. A responsive design that adjusts seamlessly to different screen sizes can greatly enhance the experience. Don’t forget to test your forms on a variety of mobile devices to catch and resolve any issues before your users do.
How can real-time analytics help reduce form drop-off rates?
How Real-Time Analytics Can Minimize Form Drop-Off Rates
Real-time analytics gives you instant insight into how users are interacting with your forms. It pinpoints potential problem areas, like fields where users often abandon the form or take too long to fill out.
By tackling these issues as they happen, you can make quick adjustments to improve the overall user experience. This could mean simplifying a confusing question, reducing the number of fields, or clarifying instructions. These timely tweaks not only make the form process smoother but also help boost your conversion rates.
Another advantage? Real-time data speeds up decision-making. With immediate feedback, you can implement targeted actions to keep users engaged and prevent them from dropping off.
Related posts
Get new content delivered straight to your inbox

The Response
Updates on the Reform platform, insights on optimizing conversion rates, and tips to craft forms that convert.


Drive real results with form optimizations
Tested across hundreds of experiments, our strategies deliver a 215% lift in qualified leads for B2B and SaaS companies.
