
.webp)
Key Metrics for Dynamic Lead Scoring Models


Dynamic lead scoring models evaluate prospects in real-time, adjusting scores based on actions like visiting pricing pages or signing up for webinars. This approach outperforms static scoring by continuously reflecting buyer behavior, ensuring sales teams focus on leads with the highest potential. Companies like Adobe and Marketo have seen significant boosts in sales productivity and lead conversion rates using dynamic scoring.
Key Metrics to Track:
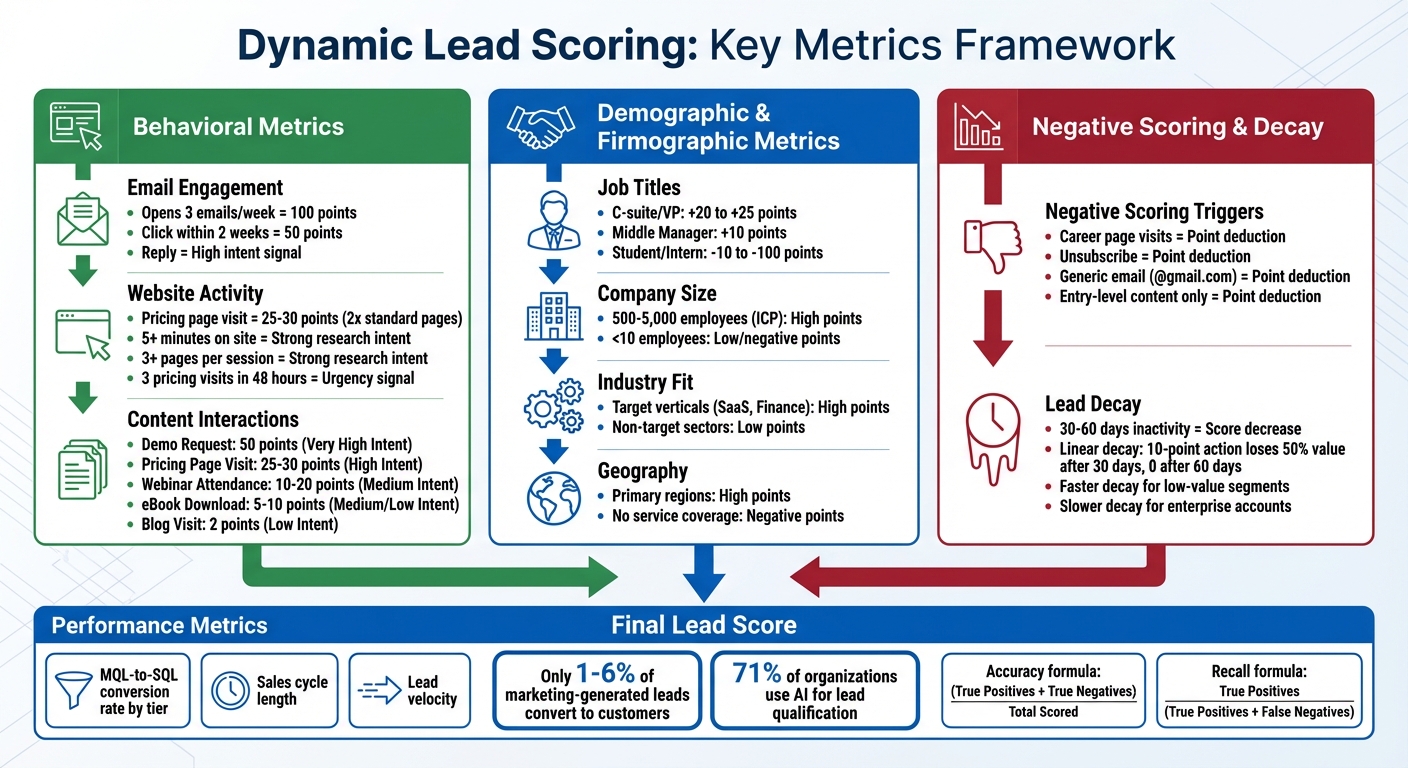
- Behavioral Metrics: Email engagement (opens, clicks, replies), website activity (pricing page visits, time on site), and content interactions (demo requests, webinar attendance).
- Demographic & Firmographic Metrics: Job titles, company size, industry alignment, and geography to ensure leads match your Ideal Customer Profile.
- Negative Scoring & Lead Decay: Deduct points for low-intent actions (e.g., career page visits) and reduce scores for inactivity over time.
Performance Evaluation:
- Measure lead-to-opportunity conversion rates, sales cycle length, and accuracy of scoring thresholds.
- Regularly review and refine scoring models to align with sales team priorities and buyer behavior trends.
Dynamic scoring prioritizes high-intent leads, improves sales efficiency, and ensures resources are spent on prospects most likely to convert.
Dynamic Lead Scoring: Key Metrics Framework for Sales Teams
Dynamic Scoring tracks real time engagement to close more sales
Behavioral Scoring Metrics
Behavioral metrics focus on tracking what leads do rather than who they are. These actions provide real-time insights into intent - whether someone is simply browsing or seriously considering your product. The challenge lies in distinguishing between casual engagement (like reading a blog) and signals that indicate a real buying interest (like visiting the pricing page).
Email Engagement Metrics
Email interactions are a direct way to measure a lead's intent. For instance, opening an email shows awareness, clicking a link suggests deeper interest, and replying often signals high intent - making such leads prime candidates for immediate sales outreach.
To illustrate, a lead who opens three emails in a week might earn 100 points, while a single click within two weeks could be worth 50 points. However, it’s crucial to limit points for repetitive, low-value actions. For example, a lead who repeatedly opens the same newsletter shouldn’t outscore a VP who clicked on your pricing page just once. Scoring should also account for the type of email - a click on a demo offer email should carry more weight than a click on a general newsletter.
Website Activity Metrics
While email metrics capture digital engagement, website activity offers deeper insights into a lead's evaluation process. Visits to high-value pages like the pricing page often carry twice the scoring weight of standard pages because they indicate active evaluation. Leads who spend more than five minutes on your site or view three or more pages in a session show strong research intent. Actions like using ROI calculators or exploring product tours deserve higher scores.
"A pricing-page visit from a high-fit decision-maker in a target account should outweigh three eBook downloads from a student intern." - LeadOps Blueprint
Frequency also matters. For instance, three visits to the pricing page within 48 hours suggest urgency. Negative scoring can also be applied - for example, visits to the career page often indicate job seekers rather than buyers.
Content Interaction Metrics
Beyond emails and website visits, content interactions add another layer to understanding lead intent. A demo request often signals immediate sales readiness, while an eBook download typically reflects early-stage awareness requiring nurturing. Similarly, attending a webinar might indicate interest in a topic but doesn’t always guarantee buying intent.
Here’s a quick breakdown of typical point values based on content type and intent:
| Content Type | Points | Intent |
|---|---|---|
| Demo Request | 50 | Very High |
| Pricing Page Visit | 25–30 | High |
| Webinar Attendance | 10–20 | Medium |
| eBook Download | 5–10 | Medium/Low |
| Blog Visit | 2 | Low |
To keep scoring relevant, apply recency modifiers - actions within the last seven days should carry more weight than those that happened a month ago. This approach ensures that actively engaged leads are prioritized.
Demographic and Firmographic Metrics
Behavioral metrics show you what leads are doing, but demographic and firmographic data reveal who they are. Together, these metrics create your "fit" score, ensuring your sales team focuses on leads that align with your Ideal Customer Profile (ICP) instead of wasting time on less promising prospects.
Demographic scoring zeroes in on individual attributes like job title and seniority, while firmographic scoring evaluates company-level factors such as industry, size, and revenue. These two perspectives answer a key question: Is this lead the right person at the right company? Without these filters, even highly engaged but low-value leads could misdirect your team’s efforts and drain resources. Let’s explore the key demographic and firmographic factors that fine-tune your lead fit score.
"The biggest lift in lead scoring is not defining how many points something is worth, it's making sure everyone internally is aligned." – Ryan Durling, Inbound Consultant, HubSpot
When sales and marketing teams align on the ICP, scoring becomes more accurate and effective.
Job Titles and Decision-Making Roles
Job titles offer an early clue about a lead’s potential influence and buying power. For instance, a C-suite executive or VP might earn +20 to +25 points, while a middle manager could receive around +10 points. On the other hand, leads with titles like "Student" or "Intern" might see deductions ranging from -10 to -100 points to prevent them from cluttering your pipeline.
Some advanced scoring systems go beyond static numbers, grouping leads into tiers - such as A, B, or C - where "A" represents high-fit decision-makers and "C" includes lower-priority influencers or researchers. Tools that enrich data can also automatically fill in missing job titles or company details, keeping your scoring accurate without requiring prospects to complete long forms.
While job titles are critical, the company’s overall profile provides additional context for lead quality.
Company Size and Industry Fit
Firmographic data helps determine whether a lead’s company fits your target market. Company size, measured by factors like employee count or revenue, acts as an essential filter. For example, if your product is tailored for mid-market businesses with 500–5,000 employees, leads from small startups or massive enterprises might receive fewer points - or even negative scores.
Industry alignment plays a similar role. Historical data often reveals that leads from key verticals, such as SaaS or finance, convert at higher rates than those from non-target sectors. These high-fit leads should earn additional points. Geographic location also matters - leads based in your primary operating regions (like the Northeastern United States) typically score higher, while those outside your service areas might be disqualified. For more advanced scoring, technographic data can confirm whether a lead’s tools and systems are compatible with your product.
| Firmographic Attribute | High-Value Example | Low-Value/Negative Example |
|---|---|---|
| Job Title | CEO, VP of Operations, CIO | Intern, Student, Consultant |
| Company Size | 500–5,000 employees (ICP) | Fewer than 10 employees |
| Industry | Strategic verticals (e.g., SaaS, Finance) | Non-target sectors (e.g., Education) |
| Geography | Primary operating regions | Regions with no service coverage |
| Email Domain | Corporate (e.g., @company.com) | Personal (e.g., @gmail.com, @yahoo.com) |
One key consideration: fit scores remain constant, but engagement scores naturally decline over time. For example, a VP at a 1,000-person SaaS company will always be a high-fit lead, even if their activity slows. This is where nurturing campaigns can step in to reignite interest, keeping them in your qualified pipeline.
sbb-itb-5f36581
Negative Scoring and Lead Decay Metrics
Not every action signals genuine buying interest. For instance, a lead who frequently visits your careers page or repeatedly downloads the same basic resource might seem active, but they could simply be job hunting or casually browsing. This is where negative scoring comes into play - it subtracts points for behaviors that suggest low intent or misalignment. This ensures your sales team focuses on leads with real potential.
Without negative scoring, outdated or irrelevant activity can inflate a lead's score, wasting your team's time and undermining confidence in your scoring system. Seth Nagle from LZC Marketing explains it well:
"Negative scoring is the process of deducting points for behaviors that suggest a lead isn't yet ready to buy. These actions might indicate a lack of serious interest or intent to convert, making them critical to identify early".
The process is straightforward: subtract points for actions that raise red flags. For example, leads might lose points for unsubscribing from emails, using generic email domains (like @gmail.com) in B2B contexts, or listing a job title such as "Student". Similarly, leads engaging only with entry-level content, instead of exploring more advanced, purchase-related material, should also see deductions. With only 1% to 6% of marketing-generated leads converting into customers, filtering out low-intent prospects early is crucial.
Tracking Inactivity and Disengagement
While negative scoring helps weed out non-buyers, lead decay prevents outdated interactions from inflating scores. This ensures scores reflect a lead's current interest rather than past activity. If a lead shows no engagement for 30–60 days, their score should decrease. As LeadOps.io puts it:
"Decay isn't punishment - it's hygiene. You're not deleting the lead. You're de-prioritizing them until they re-engage".
Most platforms allow you to set decay intervals - such as 1, 3, 6, or 12 months (with each month defined as 30 days) - and apply either linear decay (e.g., a 10-point action loses half its value after 30 days and drops to zero after 60 days) or fixed deductions every two weeks. This approach adjusts scores based on inactivity.
The trick is to tailor decay rates to lead segments. For example, apply faster decay to lower-value segments, like small businesses, while using slower decay for high-value enterprise accounts. This prevents prematurely deprioritizing promising leads. If a lead's score falls below your threshold, it’s a clear signal to launch a re-engagement campaign.
Measuring Lead Scoring Model Performance
Creating a lead scoring model is just the first step - its real worth becomes clear when you evaluate how well it performs. Without tracking the right metrics, you risk either overwhelming Sales with unqualified leads or overlooking promising prospects. The key is ensuring your model accurately identifies buyer readiness.
The metrics outlined below help determine whether your model is effectively distinguishing genuine buyer intent from surface-level engagement. They also highlight areas for improvement - whether it's adjusting score thresholds, rebalancing behaviors, or identifying gaps where valuable leads might be slipping through.
Lead-to-Opportunity Conversion Rate
This metric answers an essential question: are your high-scoring leads actually turning into sales opportunities? If Tier 1 leads convert at the same rate as Tier 3 leads, your model isn't effectively identifying intent.
"If Tier 1 leads aren't converting, your scoring model is inflating. If Tier 3 leads are winning deals, you're underprioritizing."
To keep tabs on this, track the MQL-to-SQL conversion rate for each scoring tier. A well-tuned model should show a clear pattern - higher scores should lead to higher conversion rates. If leads just above your scoring threshold aren’t converting, it could mean your threshold is too low, or you might be assigning too much weight to low-value actions like email clicks.
Additionally, measure the false positive rate - leads that score high but are rejected by Sales as a "bad fit." Pair this with the false negative rate, which captures won deals that never reached the scoring threshold. Together, these metrics reveal noise in your model and pinpoint missed opportunities. A confusion matrix can further clarify accuracy by mapping True Positives (leads predicted to win that actually win) against False Positives (leads predicted to win that don’t).
Sales Cycle Length
An effective scoring model doesn’t just identify ready leads - it also speeds up the sales process. A shorter sales cycle is a strong indicator that your model is prioritizing the right prospects. When Sales receives leads that are truly ready, they can focus more on closing deals and less on qualification.
Track lead velocity, which measures the time it takes for a lead to move from hitting your scoring threshold to becoming an opportunity or a closed deal. Also, monitor time to first action, the time between a lead reaching a "Hot" score and the first outreach by Sales. If there’s a long delay here, even qualified leads might lose interest. The Sales Acceptance Rate (SAL) - the percentage of Marketing Qualified Leads that Sales Development Representatives (SDRs) engage with - is another valuable metric.
Lead enrichment also plays a role by improving the accuracy of qualification and reducing the need for manual prospecting. These efficiencies directly contribute to shorter sales cycles and help reps close more deals.
Score Accuracy and Distribution
Even if your conversion rates look solid, it’s important to ensure your model is properly calibrated. Calibration ensures that predicted conversion rates align with actual outcomes. For example, if a segment has a predicted 40% conversion rate, roughly 4 out of 10 leads in that group should convert.
Evaluate your model using metrics like accuracy and recall. Accuracy measures how often the model makes correct predictions (both positive and negative), calculated as (True Positives + True Negatives) divided by the total number of leads. Recall, on the other hand, measures how many actual positives the model missed, calculated as True Positives divided by (True Positives + False Negatives). The F1 score, which balances precision and recall, is particularly useful when working with unbalanced datasets.
| Metric | Formula | Purpose |
|---|---|---|
| Accuracy | (True Positives + True Negatives) / Total Scored | Measures how often the model makes correct predictions |
| Recall | True Positives / (True Positives + False Negatives) | Identifies how many actual positives the model missed |
| Conversion Rate | (True Positives + False Negatives) / Total Scored | Likelihood that a scored lead will eventually qualify or win |
Before rolling out a new model, audit the score distribution to ensure it aligns with your Sales team’s capacity. For example, if 80% of your leads suddenly qualify as "Hot", it could signal that your thresholds are too low or certain actions are overvalued.
"The model is only 'accurate enough' if score bands map to real capacity, SLAs, and programs."
To keep your model performing well, conduct light checks on thresholds monthly and more comprehensive reviews quarterly. This helps prevent "model drift", where performance declines as buyer behavior evolves. Include feedback loops by allowing SDRs to tag leads as "False Positive." This data is essential for retraining and fine-tuning your scoring model.
"If Sales isn't using the score, the score doesn't matter."
Conclusion
Dynamic lead scoring works best when the right metrics come together to assess a buyer's true readiness. The most successful models blend these metrics into a single score that reliably predicts the likelihood of conversion.
"No matter how accurate your model, if it doesn't drive timely, appropriate action from Sales or SDRs, it fails its only job: to turn buyer signals into pipeline motion."
- LeadOps Blueprint
Once you've identified the key metrics, the next step is ensuring they lead to actionable results. The metrics shared here are designed to cut through the noise and highlight genuine buying intent. But simply measuring intent isn’t enough. Your scoring model must trigger specific actions: for example, routing high-priority (Tier 1) leads to Sales within 24 hours, placing lower-priority (Tier 3) leads into automated nurture campaigns, and applying score decay to avoid wasting time on outdated opportunities.
Stick to 5–7 core metrics that account for the majority of conversions - around 80% - and revisit your model every quarter to adapt to changes in buyer behavior and spot any false positives. It's worth noting that 71% of organizations now rely on AI to enhance lead qualification. However, even the most advanced scoring system will fall short if it doesn’t align with how your Sales team operates. Ensuring this alignment is what completes the dynamic lead scoring process.
When done right, a well-tuned scoring model drives clear actions, transforming buyer signals into a streamlined pipeline that directly impacts revenue.
FAQs
What makes dynamic lead scoring models different from static ones?
Dynamic lead scoring models have a unique advantage: they update in real time. By factoring in a lead's most recent actions and behaviors, these models allow businesses to prioritize leads with greater accuracy as their interests and engagement levels change.
On the other hand, static lead scoring models rely on fixed criteria that don’t adapt over time. This can lead to scores that fail to reflect a lead’s current behavior or shifting needs, making them less effective in capturing real-time opportunities.
What behavioral metrics should you focus on for effective lead scoring?
When creating a lead scoring model, it’s important to zero in on behavioral metrics that highlight a prospect's level of interest and likelihood to buy. Actions like visiting your website, downloading resources, opening emails, clicking links, or interacting with marketing materials provide valuable clues about their engagement and intent.
Pay special attention to high-impact activities such as requesting a demo, signing up for a webinar, or consuming premium content. These actions often signal a stronger intent to purchase. To sharpen your scoring even further, blend this behavioral data with firmographic details or third-party insights. This approach ensures your team can concentrate on leads with the highest potential to convert, ultimately improving lead quality and driving better conversion rates.
What are negative scoring and lead decay, and how do they help prioritize leads?
Refining lead prioritization can be a game-changer, and negative scoring and lead decay are two strategies that can make a big difference.
With negative scoring, leads that exhibit behaviors or traits indicating low interest or a poor fit are assigned lower or even negative points. This approach helps weed out less promising prospects, allowing teams to focus their time and effort on leads that are more likely to convert.
On the other hand, lead decay works by gradually reducing a lead’s score if there hasn’t been any recent engagement. This ensures that inactive or outdated leads don’t clog up the pipeline, keeping the focus on those who are actively interacting and showing interest.
When these strategies are used together, businesses can dynamically adjust their scoring models. This helps sales teams zero in on the most promising leads, improving efficiency and ensuring that resources are directed where they’re needed most.
Related Blog Posts
Get new content delivered straight to your inbox

The Response
Updates on the Reform platform, insights on optimizing conversion rates, and tips to craft forms that convert.


Drive real results with form optimizations
Tested across hundreds of experiments, our strategies deliver a 215% lift in qualified leads for B2B and SaaS companies.
