
.webp)
Top KPIs for Marketing Automation Dashboards


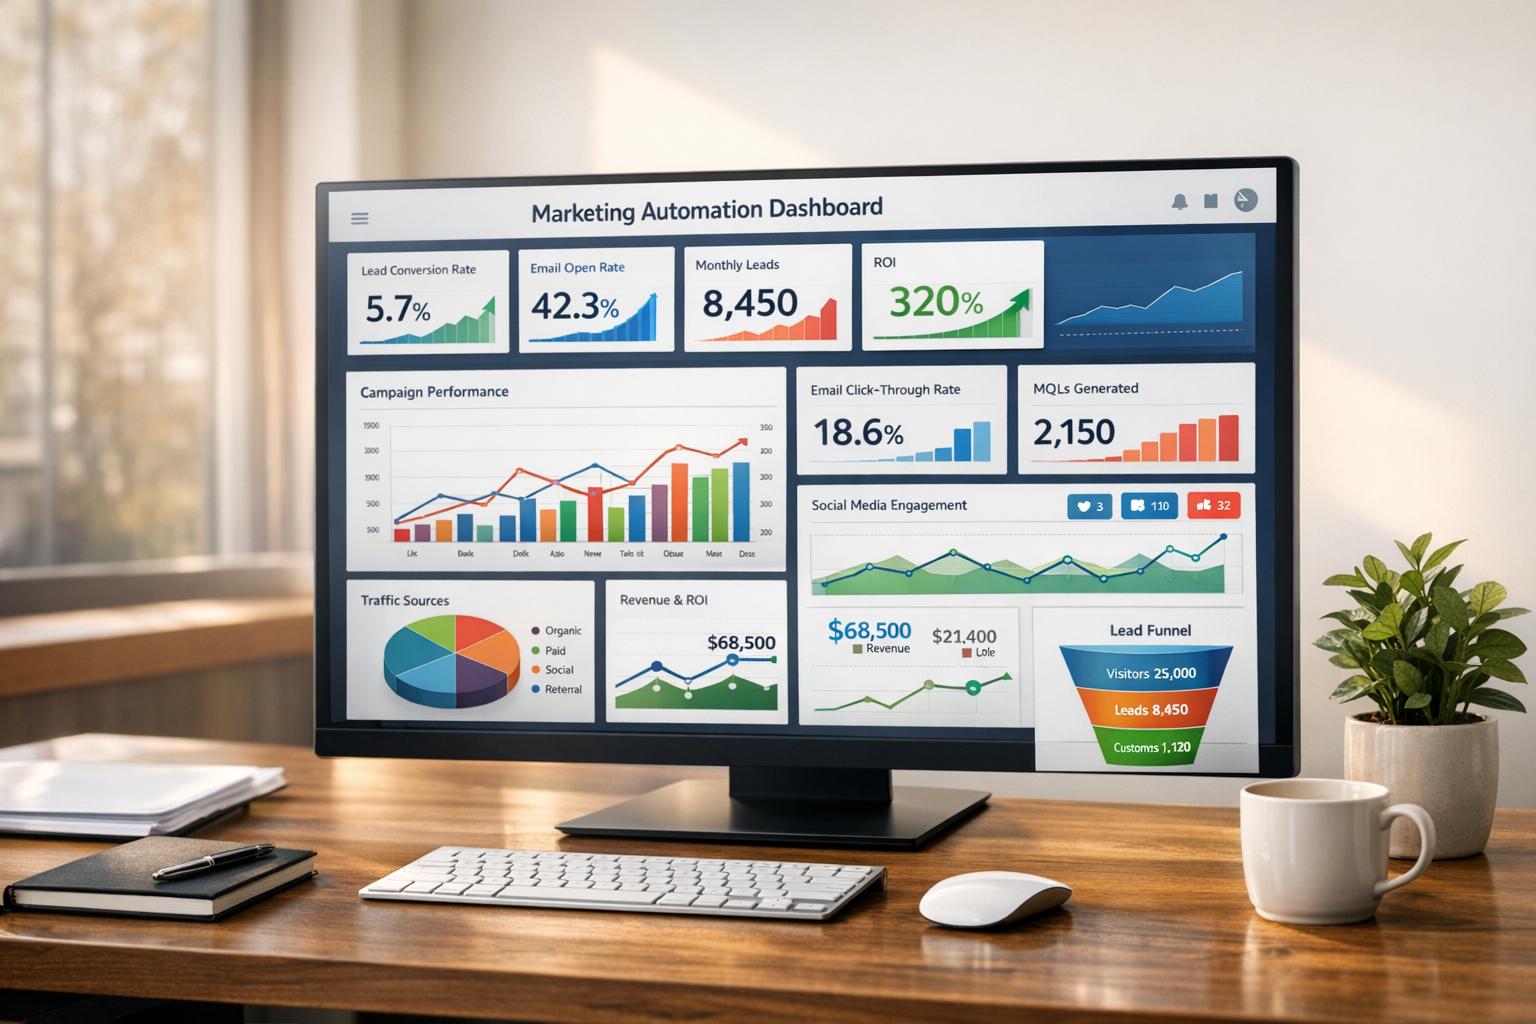
Marketing automation dashboards are only as effective as the KPIs you track. To drive results, focus on metrics that align with your goals and provide actionable insights. Here are the top KPIs every marketer should prioritize:
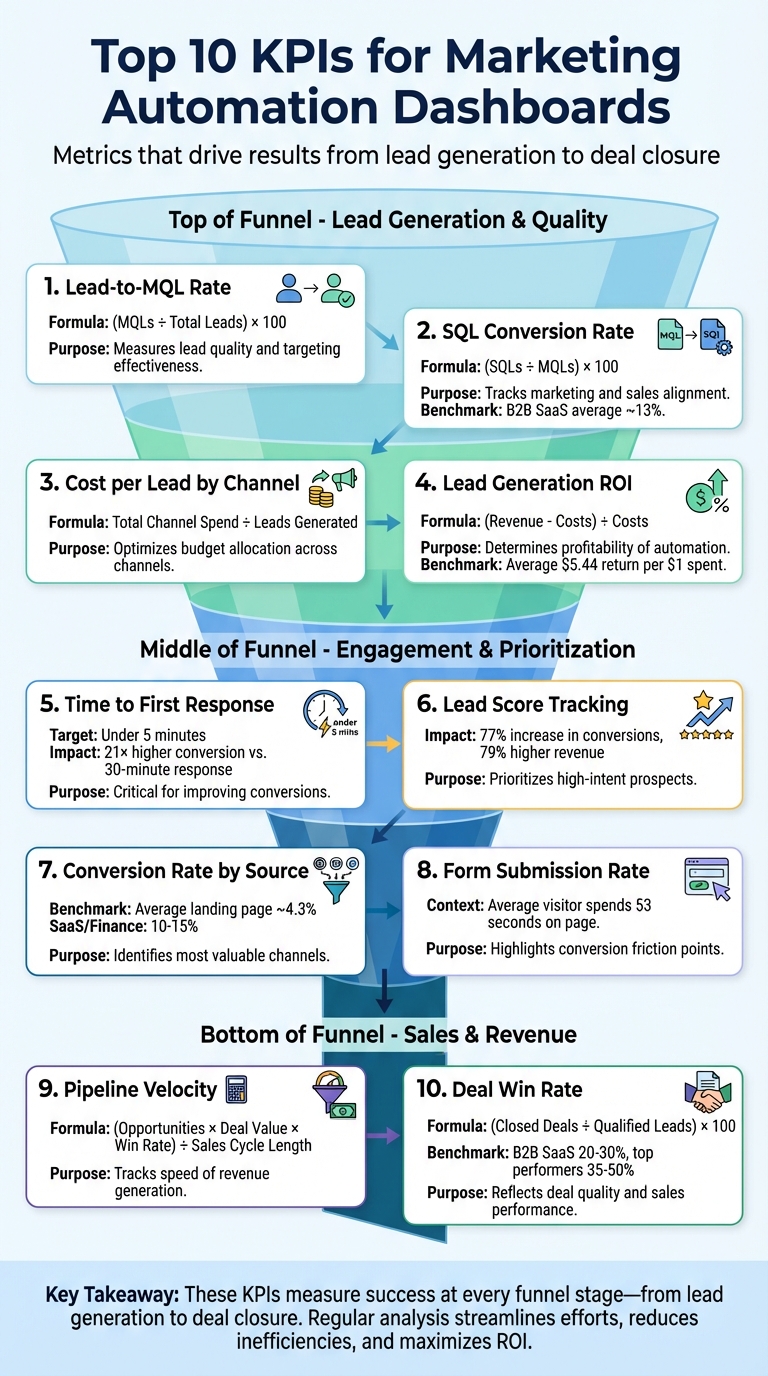
- Lead-to-MQL Rate: Measures the percentage of leads turning into Marketing Qualified Leads (MQLs). Helps evaluate lead quality and refine targeting.
- SQL Conversion Rate: Tracks how many MQLs convert into Sales Qualified Leads (SQLs), ensuring marketing and sales alignment.
- Cost per Lead by Channel: Calculates the cost of acquiring leads per channel, helping optimize budget allocation.
- Lead Generation ROI: Assesses the revenue generated versus automation costs to determine profitability.
- Time to First Response: Monitors how quickly your team responds to new leads, critical for improving conversions.
- Lead Score Tracking: Ranks leads based on their fit and engagement, ensuring sales teams focus on high-intent prospects.
- Conversion Rate by Source: Identifies which marketing channels deliver the most valuable leads.
- Form Submission Rate: Measures the percentage of visitors completing forms, highlighting areas for improvement.
- Pipeline Velocity: Tracks how quickly leads move through the sales funnel, impacting revenue speed.
- Deal Win Rate: Calculates the percentage of opportunities that turn into closed deals, reflecting deal quality and sales performance.
Key Takeaway: These KPIs help you measure success at every stage of the funnel, from lead generation to deal closure. By regularly analyzing these metrics, you can streamline your marketing efforts, reduce inefficiencies, and maximize ROI.
Top 10 KPIs for Marketing Automation Dashboards
Marketing KPIs template in Google Sheets [Marketing KPIs dashboard]
1. Lead to MQL Rate
The Lead to MQL Rate is calculated using the formula: (MQLs ÷ Total Leads) × 100. This metric helps you determine whether your efforts are bringing in high-quality leads or just a large volume of them.
"A strong lead-to-MQL rate shows that your marketing efforts are attracting and developing the right audience, making it a key signal of marketing automation success at the top of the funnel." – Keen
Why it matters: Imagine generating 1,000 leads but only converting 50 into MQLs. That would indicate issues like misaligned messaging or weak nurturing strategies. It’s no wonder that nearly 80% of marketers attribute their success to marketing automation, with 61% specifically using it to boost lead generation.
To improve this rate, start by analyzing your data by channel. Identify which channels are delivering the best results so you can allocate your budget more effectively. For example, if you're running paid social campaigns, refine your audience targeting by incorporating demographic scoring to attract higher-quality leads.
Revisit your lead scoring process:
If your Lead to MQL Rate is high but the leads aren’t converting into sales, it might be time to tighten your MQL criteria. On the other hand, if the rate is too low, consider simplifying your forms or adding intent-based questions to encourage quicker engagement.
Tools like Reform can make a big difference here. Their lead enrichment and real-time analytics help you pinpoint form submissions that show genuine buying intent. This allows you to identify true MQLs before they even enter your CRM.
Once you've optimized this step, it’s time to focus on your SQL Conversion Rate to refine your funnel further.
2. SQL Conversion Rate
After diving into lead-to-MQL insights, the next step is understanding the SQL Conversion Rate, which is all about fine-tuning the quality of your sales funnel. This metric calculates the percentage of Marketing Qualified Leads (MQLs) that your sales team accepts as Sales Qualified Leads (SQLs). The formula? (SQLs ÷ MQLs) × 100.
"SQLs measure how many leads marketing is delivering that sales actually wants to talk to. This alignment is critical. If marketing is focused on volume over quality, it can waste time and damage credibility." – IMPACT Team
Conversion rates vary widely depending on the industry. For example:
- Business Insurance and HVAC sectors hover around 26%.
- eCommerce averages about 23%.
- B2B SaaS, Financial Services, and Healthcare typically see rates near 13%.
- Legal Services and Real Estate tend to have lower rates, closer to 10%.
If your rates fall below these benchmarks, it could signal issues like unqualified leads or gaps in your nurturing processes.
To improve SQL conversions, ensure your CRM is synced with your marketing automation platform to track all lead interactions seamlessly. Automated lead scoring can also make a big difference. For instance, tracking key actions - like visits to pricing pages or demo requests - can help pass only high-intent leads to your sales team.
Here’s a real-world example: In 2025, a B2B SaaS company reduced the number of fields on its demo request form from 10 to just 4. This simple change boosted their landing page conversions from 3% to 7%. If your SQL Conversion Rate is lagging, consider auditing your form fields and lead qualification process. Tools like Reform, a no-code form builder geared toward conversions, can help you create streamlined forms that capture higher-quality leads.
From here, it’s worth analyzing Cost per Lead by Channel to identify which sources bring in the most valuable SQLs.
3. Cost per Lead by Channel
To figure out how much you're spending to generate each lead, calculate the Cost per Lead (CPL) for each marketing channel. This is done by dividing the total amount spent on a specific channel by the number of leads it produced. For example, if you spent $5,000 on Google AdWords and got 500 leads, your CPL would be $10. This simple calculation sets the stage for evaluating both the quality of those leads and the effectiveness of each channel.
Ahlem Mahroua from bHYP explains it best: "Cost per lead will tell you whether your investments are positively impacting the bottom line or not". A $10 lead might seem like a win - until deeper analysis shows those leads rarely convert. On the other hand, a $60 lead from a webinar could result in a $2,500 customer, making it far more worthwhile.
Visualizing CPL can help you spot trends and compare performance across channels. Use bar charts for side-by-side comparisons and line graphs to monitor changes over time. To make this data actionable, add green and red indicators to highlight channels that meet or exceed cost benchmarks. Layer in quality metrics, like MQL-to-SQL conversion rates, to confirm which leads are truly delivering value.
Real-time tracking is another game-changer. It can alert you to sudden spikes in CPL, giving you the chance to adjust budgets immediately. Improvado highlights this benefit: "If your cost per lead on Facebook suddenly spikes... a dashboard alerts you instantly, allowing you to react quickly, shifting budget, pausing a failing ad, or doubling down on a winner". For instance, in December 2025, a yoga studio tracked its CPL across Instagram ads, email campaigns, and local partnerships. By spending $600 to acquire 50 new members, they calculated a CPL of $12. This insight helped them decide if their $50 monthly membership fee justified the spend. These kinds of real-time insights drive smarter decisions and continuous improvement.
If your CPL starts climbing, it’s time to audit your landing pages and forms. For example, a fitness training academy saw results by tweaking their email call-to-action from a generic prompt to "Reserve your seat now," which increased their click-through rate from 0.8% to 3.5% and lowered their CPL. Simplifying form fields can also improve conversion rates. These small but impactful changes allow you to refine your campaigns and get better results.
4. Lead Generation ROI
Lead Generation ROI measures the profit generated from marketing automation compared to its cost. To calculate it, subtract the total automation expenses from the revenue it generates, then divide that number by the expenses. For instance, if your automation efforts bring in $100,000 in revenue and cost $20,000, the ROI would be 400% (or 4×).
Revenue includes not only direct sales but also the time saved through automation. On the other hand, costs encompass software licenses, setup fees, training, and management salaries. For example, annual investments often include platform subscriptions, onboarding costs, and salaries for those managing the system. To ensure your metrics align with industry standards, review benchmarks and methodologies for ROI tracking.
On average, organizations using marketing automation see a return of $5.44 for every $1 spent within the first three years. Email automation, in particular, delivers an impressive return of $36 for every $1 spent . ROI for marketing automation essentially reflects the value it creates compared to its cost.
For B2B companies with sales cycles lasting 3–6 months, positive ROI typically appears within 9 to 12 months. This initial phase is often dedicated to system setup and creating foundational campaigns. Using multi-touch attribution models can help you fairly allocate credit to each campaign's contribution to revenue. Once your ROI is accurately tracked through clear attribution, you can focus on refining your system to maximize returns.
If your ROI isn’t meeting expectations, it’s time for a system audit. Start by removing inactive contacts, simplifying workflows, improving lead scoring (e.g., assigning lower value to low-intent interactions), and adjusting email schedules . These tweaks, combined with real-time performance monitoring discussed earlier, ensure that ROI remains the definitive measure of your marketing automation's success.
5. Time to First Response
Time to First Response tracks how quickly you reach out to a lead after their initial interaction - whether it’s a form submission, demo request, or visit to your pricing page. This metric is crucial for conversions because today’s buyers expect fast engagement. Studies show that responding within 5 minutes increases conversion chances by 21 times compared to waiting 30 minutes. Even a slight delay - just 10 minutes - can slash qualification odds by 4 times.
The average response time across industries is 42 hours, and for B2B, it’s still a lengthy 11 hours 54 minutes. These numbers highlight a huge gap for improvement. Barry Blassoples, Head of Customer Success at timetoreply, emphasizes this urgency:
"The consensus in the sales and marketing industry is that the ideal lead response time for inbound leads is within five minutes of their initial inquiry".
To measure this KPI, track the time between a lead’s first action and your team’s initial response. Use timestamped data from your platform to monitor delays in real time. Setting up automated alerts in your CRM can help managers take immediate action when response times exceed your goal - ideally under 5 minutes. This ensures leads don’t go cold while your team is tied up elsewhere.
Implement behavioral triggers to send instant automated responses for high-intent actions like demo requests or abandoned carts, followed by a human follow-up. In B2B settings, while 15% of inbound demo requests close quickly, adding automated follow-ups can increase conversions by an additional 20% within 30 days. Tools like Reform make this process smoother by offering real-time analytics on form submissions and syncing with your CRM to trigger immediate workflows.
If your response times are consistently slow, it’s time to review your lead handoff process between marketing and sales. Delays often point to bottlenecks in qualification criteria or unclear ownership. Address this by clearly defining what makes a lead “qualified,” simplifying high-intent forms to reduce friction, and using lead scoring to prioritize immediate human follow-up for hot prospects. Lower-priority leads can continue through automated nurture sequences. As Team Braze puts it:
"Days-old data is dead data. Your customers are moving fast, and so should your insights.".
Regularly auditing your handoff process ensures no high-intent lead falls through the cracks, setting you up for success in the later stages of your funnel.
6. Lead Score Tracking
Lead Score Tracking is a way to rank potential customers by assigning scores based on their demographic profile and engagement with your brand. This metric helps sales teams zero in on leads that are ready to buy, while also identifying those who need more nurturing - saving time and effort. In fact, companies that use lead scoring see a 77% increase in conversions and 79% higher revenue. It bridges the gap between sales and marketing by establishing clear criteria for qualifying leads.
A strong scoring model evaluates leads on two key dimensions: "Fit" (attributes like job title, industry, and company size) and "Engagement" (actions such as requesting a demo, visiting a pricing page, or clicking on emails). Reviewing score distributions helps fine-tune thresholds. For example, if the threshold is too low, unqualified leads might flood the sales team; too high, and promising prospects could be overlooked. Don’t forget to factor in negative scoring - deducting points for behaviors like visiting career pages, unsubscribing, or showing inactivity over time.
Ryan Durling, an Inbound Consultant at HubSpot, explains:
"The biggest lift in lead scoring is not defining how many points something is worth, it's making sure everyone internally is aligned".
For lead scoring to work, sales and marketing teams must agree on when a lead qualifies as a Marketing Qualified Lead (MQL) and is ready for follow-up. A simple model with fewer than 10 criteria and clear guidelines works best. Josh Bean, Director of Marketing at Zendesk, emphasizes:
"The motto of a good lead scoring model is not 'set it and forget it' - it's 'design it and refine it'".
Revisit your scoring model at least once every quarter. If your MQL-to-conversion rates are slipping, it could mean your target customer profile has shifted or your scoring thresholds need tweaking. Regular updates ensure your scoring adapts to evolving buyer behavior.
Many teams now use AI-powered predictive lead scoring, which analyzes historical data to uncover patterns that traditional methods might miss. Tools like Reform enhance this process by collecting high-quality lead data through optimized forms with lead enrichment features. These tools can sync directly with your CRM, triggering automated workflows based on lead scores. By incorporating these refined scores into your dashboard, you can act quickly on top-tier leads while keeping lower-priority prospects in nurturing campaigns. This approach ensures your efforts are both efficient and effective, driving higher conversion rates.
sbb-itb-5f36581
7. Conversion Rate by Source
Conversion Rate by Source helps identify which marketing channels bring in the most high-quality leads and contribute to business growth. On average, landing pages across industries convert at about 4.3%, but industries like SaaS and finance often see conversion rates between 10–15%. By tracking this metric, you can separate the channels that truly drive growth from those that simply inflate your traffic numbers.
To get a clearer picture, calculate Revenue per Lead (RPL) by dividing a channel's total revenue by the number of leads it generates. For instance, while a webinar might attract fewer leads than a social ad campaign, its higher conversion rate could make it a more valuable channel. As Don Seaberry, Director of Digital Marketing, puts it:
"The goal should always be to manage the actual goal (ROI) and not just cost-per-click or click-through rates".
Visual tools like bar charts can help you compare ROAS (Return on Ad Spend) across channels, while funnel charts can show how effectively each source progresses through your pipeline. Use color-coded indicators to highlight underperforming channels, and pay attention to bounce rates over 60%, as they may signal issues with messaging or landing page alignment. To improve results, A/B test landing pages tailored to specific sources, using customized headlines and CTAs to create a consistent and engaging experience.
Multi-touch attribution models can provide deeper insights into how different channels contribute along the customer journey. Rather than crediting just the final interaction, this method shows how one source might spark interest while another closes the deal. Including fields like "How did you hear about us?" in your forms can also help capture word-of-mouth and less trackable sources like dark social referrals. Tools such as Reform make this process easier by automatically capturing source data, syncing it to your CRM, and triggering workflows based on performance.
Finally, monitor lead velocity by channel to identify which sources convert leads into revenue the fastest. This level of analysis gives you the insights needed to focus on the channels that truly accelerate growth.
8. Form Submission Rate
The form submission rate tells you the percentage of visitors who complete a form - whether it's for a demo request, content download, or simply a contact form. This metric is a clear indicator of how well your marketing efforts are converting casual browsers into potential leads. Considering that the average visitor spends just 53 seconds on a webpage, every second counts when it comes to form performance.
Tracking this KPI is crucial for identifying where potential leads abandon the process. For instance, you might discover that a long contact form sees a sharp drop-off at a specific field, or a multi-step form loses users early in the process. This insight allows you to move from guesswork to actionable changes.
"By analyzing the conversion rate of various forms, you can identify which landing pages are performing best and which could be improved." – Insightly
This understanding paves the way for using real-time analytics to fine-tune your forms even further.
Reform’s real-time analytics help you track submissions, flag drop-off points, and sync data directly with your CRM. If you notice a sudden spike in form abandonment - possibly due to a broken field or logic error - you can quickly test fixes with A/B variations of CTAs, form field requirements, or layouts. Additionally, Reform’s incomplete response tracking captures partial submissions, offering valuable insights into leads who started but didn’t finish the process. This kind of data makes it easier to take meaningful steps toward better lead generation.
Beyond just counting submissions, pairing this metric with the average lead score provides a more complete picture. It helps you determine whether your forms are attracting high-quality prospects or just generating large numbers. Striking this balance between quantity and quality is essential for optimizing your marketing efforts to drive revenue growth. Next, let’s explore how these insights fit into your broader dashboard strategy.
9. Pipeline Velocity
Pipeline velocity tracks how quickly revenue moves through your sales pipeline - essentially, how fast leads turn into closed deals. Unlike metrics that focus on isolated aspects like the number of opportunities or win rates, this metric combines several factors to provide a clearer picture of pipeline speed. The formula is straightforward: multiply the number of opportunities by the average deal value and win rate, then divide by the sales cycle length.
Here’s an example: A B2B SaaS company with 200 opportunities, an average deal value of $1,500, an 18% win rate, and a 15-day sales cycle would generate $3,600 in daily pipeline velocity. On the other hand, an enterprise SaaS business with 110 opportunities, a $60,000 average deal value, a 30% win rate, and a 90-day cycle would achieve $22,000 per day. These numbers highlight both how efficiently deals are closed and how effective your marketing efforts are. This clarity helps you make informed improvements to your sales dashboard.
Your dashboard can also help identify where things slow down - whether it’s delays in proposal reviews, pricing discussions, or follow-ups. Tools like stage duration reports can show how long opportunities stay in each step, while drop-off visualizations pinpoint where prospects tend to exit the pipeline most often.
"In business, time equates to money. If your pipeline moves sluggishly or leads fail to convert into customers with the expected speed, you could be troubled by underperformance in your reports." – Meghraj Gore, Salespanel
To speed up pipeline velocity, focus on these four key areas:
- Improve lead quality: Refine your Ideal Customer Profile and implement lead scoring to prioritize high-potential prospects.
- Shorten the sales cycle: Use automated follow-ups and cut out unnecessary approval steps to keep things moving.
- Increase win rates: Strengthen your qualification process to focus on leads most likely to close.
- Boost deal values: Target higher-tier segments or introduce upsell opportunities earlier in the process.
Even small improvements in one of these areas can create a significant ripple effect on your daily revenue. Once you’ve optimized pipeline velocity, it’s time to fine-tune other metrics to keep building a stronger sales funnel.
10. Deal Win Rate
Deal Win Rate tracks the percentage of qualified opportunities that successfully convert into customers. To calculate it, divide the total number of sales by the total number of qualified leads, then multiply by 100. This metric is a key indicator of whether your marketing automation efforts are delivering prospects that are truly ready to buy.
Industry benchmarks offer some perspective. Most B2B SaaS companies see win rates between 20-30%, while top-performing businesses achieve rates of 35-50%. Companies with structured sales processes can experience win rates that are 28% higher than those without, and organizations with strong alignment between sales and marketing report a 38% increase in win rates.
To monitor this effectively, ensure your CRM is seamlessly integrated with your marketing automation tools. This way, sales outcomes can automatically update your dashboards. Additionally, using multi-touch attribution can help pinpoint which specific interactions - like emails, blog posts, or webinars - played a role in converting leads into customers. This provides a clearer picture of how your automated campaigns contribute to closing deals, beyond just the first or last touchpoints.
"Marketing automation contribution to total closed-won deals... is critical for measuring marketing automation success, especially when proving impact beyond the top of the funnel." – Keen
If your win rate is lagging behind industry averages, consider refining your lead qualification process. High-performing companies that emphasize quality over quantity in their leads report 58% higher win rates. Adjusting your lead scoring criteria to ensure only high-intent prospects are passed to sales can make a significant difference. Conducting formal win/loss analyses can also uncover trends and improve win rates by 15-30%.
Next, take a closer look at your dashboards to uncover more ways to optimize your marketing automation insights.
Dashboard Best Practices
A cluttered dashboard loses its purpose. Stick to displaying five to nine core KPIs to ensure critical metrics don’t get lost in the noise. As Hannah Harris from HubSpot explains:
"If this number took a nosedive tomorrow, would it seriously mess with your goals? If yes, it probably belongs on the dashboard".
Position the most important metrics in the top-left corner of the dashboard. This prime spot should highlight key lead generation metrics like Lead-to-MQL rate, SQL conversion, and cost per lead. Think of the dashboard as your mission control - it should allow you to quickly identify what's working and what needs attention in under 60 seconds, without requiring you to jump between different tools.
Choose the right visual representation for each metric. Line and column charts are ideal for tracking trends over time, making it easy to spot sudden dips in leads or spikes in unsubscribes. Bar charts are great for comparing performance across campaigns or channels, while stacked charts shine when showing composition data, like the percentage of traffic from various sources. Before building the dashboard, sketch out the layout to ensure the most essential data gets top priority.
Adapt the dashboard to its intended audience. For example, a CMO might need a high-level overview with ROI figures and visual trends, while a Marketing Manager would benefit from tactical details, like channel-specific breakdowns and real-time pacing data. Each KPI should serve a purpose - if a metric doesn’t prompt a decision or spark a discussion when it changes significantly, it’s better left off the dashboard.
Finally, pair these design principles with real-time data tools to enhance decision-making. Tools like Reform can track form submission rates and conversion performance live, enabling your team to respond immediately to shifts in engagement. This real-time visibility helps quickly address issues like declining engagement or changes in lead quality, ensuring the team stays focused on the metrics that truly matter.
Conclusion
Creating effective dashboards is just the starting point - what truly matters is focusing on KPIs that align with and influence your business goals. Dashboards only deliver real value when they track metrics that genuinely impact outcomes, not just surface-level numbers.
As Team Braze highlights:
"Without clear KPIs, it's hard to know if your marketing automation is actually working. Tracking the right metrics brings structure and accountability to your strategy."
Having real-time visibility is crucial. A well-optimized dashboard can confirm that your workflows are running smoothly and immediately flag issues, such as trigger misfires or unexpected shifts in lead quality or conversions. This kind of instant feedback allows you to act quickly, protecting performance and enabling adjustments before small problems snowball into revenue losses. It’s about staying proactive and adaptable.
To make your efforts count, focus on KPIs like Lead-to-MQL rates, SQL conversion rates, and pipeline velocity. These metrics drive actionable decisions, unlike vanity metrics such as the total number of emails sent. Regularly auditing your KPIs ensures they stay relevant to your current business objectives, and using A/B testing helps refine your automated workflows with data-driven insights. Tools like Reform’s real-time analytics provide live updates on form submissions and conversion rates, giving your team the information they need to make smarter, faster decisions and keep campaigns on track.
Marketing automation isn’t a “set it and forget it” solution. The most successful strategies evolve continuously, using KPIs to guide improvements. When your dashboard focuses on metrics that truly matter, you can clearly demonstrate the financial impact of your marketing efforts and prioritize actions that drive real growth in lead generation and revenue.
FAQs
What are the key KPIs to track for marketing automation success?
To gauge how well your marketing automation is working, keep a close eye on these key performance indicators (KPIs):
- Email open rate: This tells you how many recipients are opening and engaging with your emails.
- Click-through rate (CTR): Tracks the percentage of people clicking on links within your emails or campaigns.
- Lead-to-customer conversion rate: Measures how effectively your leads are turning into paying customers.
- Qualified leads generated: Highlights the number of high-quality leads your campaigns are bringing in.
- Customer acquisition cost (CAC): Calculates how much you're spending to gain each new customer.
- Marketing ROI: Assesses the overall return on investment from your marketing activities.
By regularly tracking these KPIs, you’ll gain insights to fine-tune your campaigns, enhance lead quality, and boost your conversion rates.
What are the best ways to improve my lead-to-MQL conversion rate?
Improving your lead-to-MQL conversion rate hinges on two key factors: the quality of your leads and how quickly you respond to them. Start by setting up a solid lead-scoring system. This helps you rank prospects based on their fit and intent, so you can focus your efforts on high-potential leads instead of wasting time on those unlikely to convert. Speed matters, too - responding to new leads within 5 minutes can drastically improve your chances of turning them into MQLs. Automation can be a game-changer here, helping you follow up faster and route leads to the right team member without delay.
It’s also important to fine-tune your messaging and offers to move leads smoothly from awareness to genuine interest. Experiment with different strategies and keep an eye on metrics like MQL-to-SQL conversion rates and cost-per-MQL to figure out which channels and content are driving results. Tools like Reform can simplify this process. With customizable, multi-step forms, you can gather detailed lead information. Features like conditional routing and real-time analytics make nurturing leads more efficient, while lead enrichment and email validation ensure your data stays accurate - both of which are critical for boosting your conversion rate.
Why is real-time tracking important for marketing automation dashboards?
Real-time tracking is crucial for marketers as it delivers up-to-the-minute insights into how campaigns are performing. This means teams can quickly spot what's working, address problems right away, and make timely adjustments to boost lead generation and conversion rates.
With live data at their fingertips, marketers can make faster, more informed decisions. This not only keeps campaigns running efficiently but also allows businesses to adapt swiftly to market trends and shifts in customer behavior, helping to get the most out of their marketing investments.
Related Blog Posts
Get new content delivered straight to your inbox

The Response
Updates on the Reform platform, insights on optimizing conversion rates, and tips to craft forms that convert.


Drive real results with form optimizations
Tested across hundreds of experiments, our strategies deliver a 215% lift in qualified leads for B2B and SaaS companies.
