
.webp)
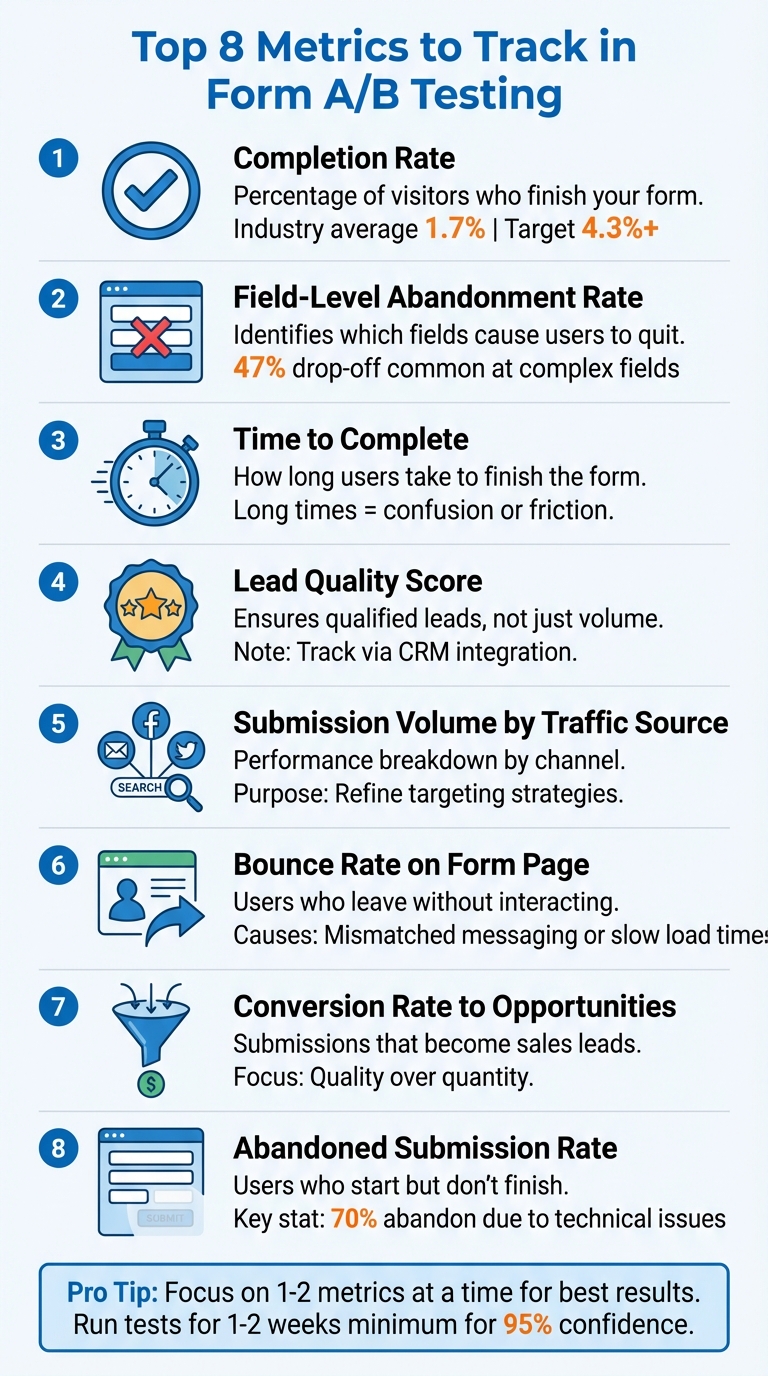
Top Metrics to Track in Form A/B Testing


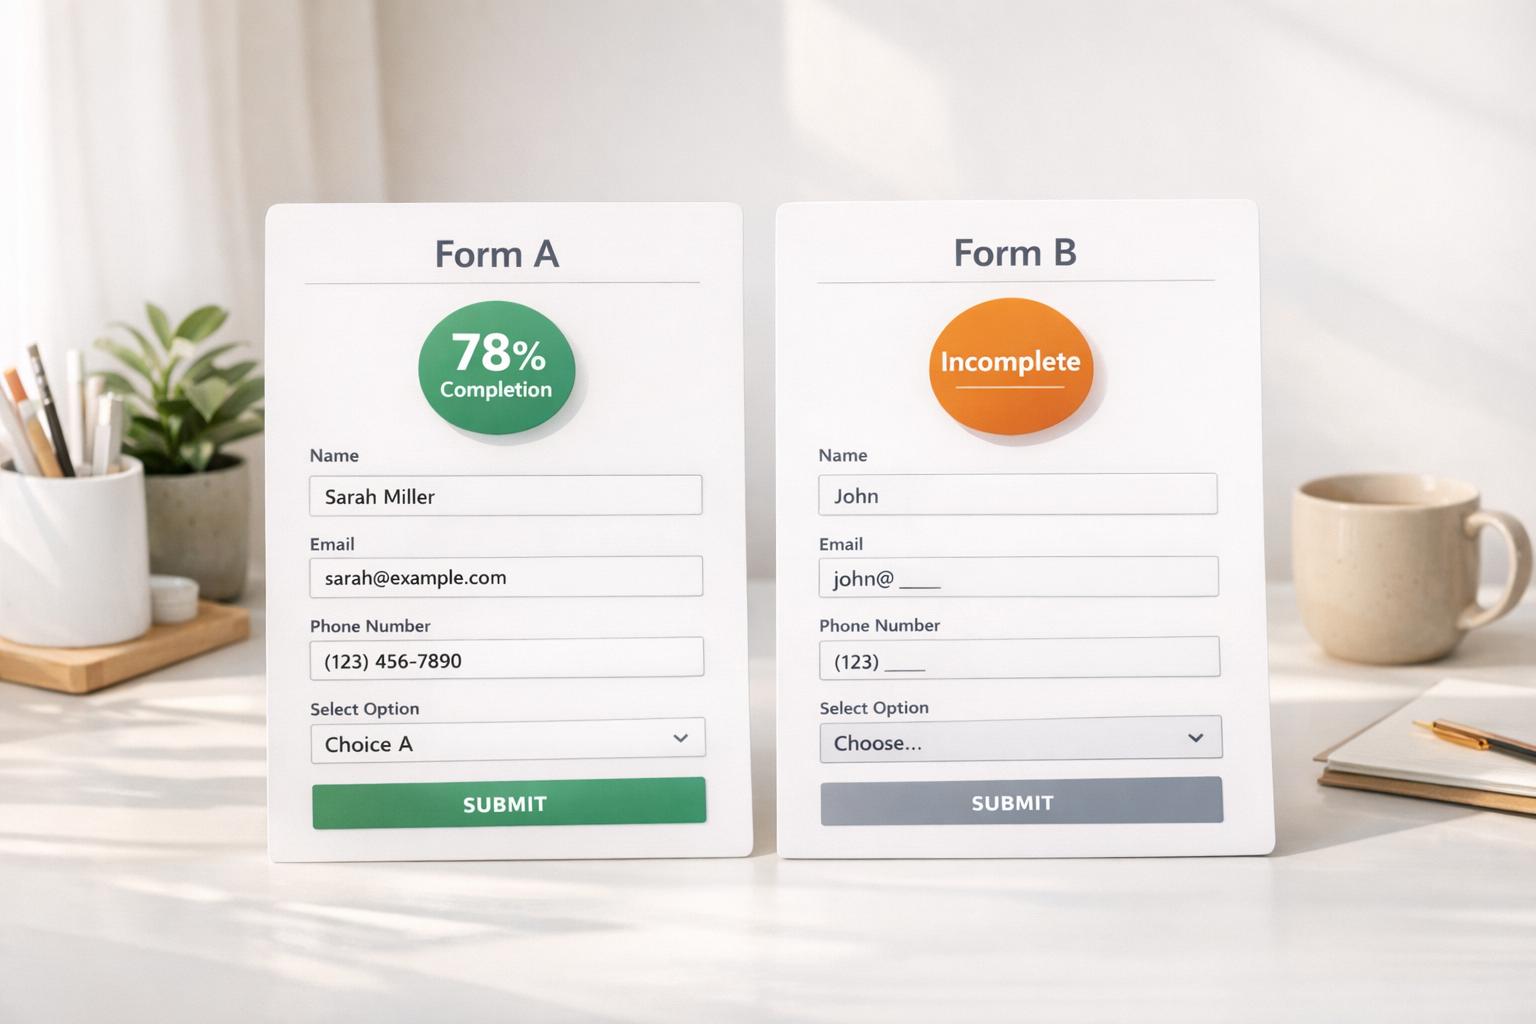
Running A/B tests on forms is pointless without tracking the right metrics. Here's what you need to focus on:
- Completion Rate: Measures how many users finish your form. A low rate often signals issues like too many fields or unclear instructions. Aim for at least 1.7% across industries.
- Field-Level Abandonment Rate: Pinpoints which specific fields cause users to quit. Removing or simplifying problematic fields can improve conversions.
- Time to Complete: Tracks how long users take to finish your form. Long times often mean confusion or friction.
- Lead Quality Score: Ensures you're getting qualified leads, not just high submission numbers. Use your CRM to evaluate.
- Submission Volume by Traffic Source: Breaks down how different channels (e.g., email, social media) perform, helping you refine targeting.
- Bounce Rate on Form Page: Tracks users who leave without interacting. High bounce rates often signal mismatched messaging or slow load times.
- Conversion Rate to Opportunities: Measures how many submissions turn into legitimate sales leads. Focus on quality over quantity.
- Abandoned Submission Rate: Tracks users who start but don’t finish. Simplifying forms and adding progress bars can help.
Pro Tip: Use tools like Reform for real-time analytics, abandoned submission tracking, and CRM integrations to streamline your testing. Focus on one or two metrics at a time for the best results.
8 Essential Metrics for Form A/B Testing Success
Mastering A/B Testing for Forms & Funnels: Complete Guide with Heyflow
1. Completion Rate
Completion rate is the percentage of visitors who successfully complete your form. To calculate it, divide the number of completed submissions by the total number of visitors, then multiply by 100. For example, if 1,000 people view your form and 43 complete it, the completion rate would be 4.3%.
This metric is central to form A/B testing because it directly measures whether your form is achieving its purpose. While other metrics add context, completion rate gives a clear picture of how well your design, copy, and field arrangement are converting visitors into leads. On average, form conversion rates across industries hover around 1.7%, though this number can vary widely depending on the complexity of the form.
Why Completion Rate Matters for Form Performance
Completion rate does more than just quantify success - it highlights potential roadblocks for users. Think of it as a health check for your form. A high completion rate suggests that users find the form easy to understand and fill out, while a low rate often points to issues like excessive length, unnecessary fields, or technical glitches.
Different types of forms come with different expectations. For instance, short forms like email signups should aim for an abandonment rate of 21% or lower, whereas longer surveys or multi-page applications typically see abandonment rates between 15% and 25%. Knowing these benchmarks helps you set realistic goals for improvement.
How It Impacts Conversion Rates
Completion rate insights are invaluable when comparing form variants during A/B testing. A higher rate clearly identifies the more effective version. For example, if one variant performs better due to changes like fewer fields, clearer instructions, or a more prominent call-to-action button, the data provides solid evidence of what works. To ensure reliable results, aim for around 1,000 visitors per variant and a p-value below 0.05, which reflects 95% confidence in your findings.
Tracking and Using Completion Rate Effectively
Tracking completion rate is simple, as most analytics tools calculate it automatically by comparing form views to submissions. But digging deeper can uncover even more insights. For instance, analyzing where users drop off - whether they view the form but don't start, or begin filling it out but fail to finish - can reveal specific pain points.
If visitors aren't starting the form, your value proposition might not be clear enough. If they start but don’t finish, certain fields may be creating friction. These insights allow for targeted fixes, such as reducing the number of required fields, adding real-time error validation, optimizing for mobile (since mobile traffic makes up over 55% of website visits), or improving page load speed. By addressing these issues, you can significantly improve your form's performance.
2. Field-Level Abandonment Rate
Field-level abandonment rate zeroes in on the exact form field where users decide to leave. While the overall completion rate shows how many users drop off, this metric reveals where they drop off. It focuses on users who interact with at least one field but don’t complete the form, setting them apart from visitors who leave without engaging at all. This level of detail allows for targeted adjustments to specific problem areas.
Relevance to Form Performance Optimization
Building on insights from overall completion rates, this metric identifies the precise points of friction. Take, for example, a pest control company that reviewed their multi-step lead form in 2025. They discovered a 47% drop-off at an open-ended text field. By removing that field, they simplified the form and improved the user experience.
Fields that ask for sensitive or hard-to-find information often cause users to abandon forms. For instance, promo code fields in abandoned checkouts average 20 seconds of user attention, compared to just 3.5 seconds in completed checkouts.
Impact on Conversion Rates
Tweaking troublesome fields can lead to significant improvements in conversion rates. For example, optimizing a form to raise the conversion rate from 2% to 5% can drive a 150% increase in leads - without spending extra on advertising. A/B testing is particularly useful here, as it compares field-level abandonment across different form versions to identify which one reduces friction most effectively.
Ease of Tracking and Actionable Insights
Specialized form analytics tools can automatically track user interactions, while some platforms may require manual tagging . Common fixes include:
- Removing unnecessary fields
- Adding microcopy to explain why sensitive information is needed (e.g., "Used for delivery updates only")
- Clearly marking optional fields as non-mandatory
- Replacing open-ended text fields with multiple-choice options to reduce cognitive effort
"Digital experiments based on UX research and analytics have higher win rates than those based on gut feeling or blindly following 'best practice'." - Zuko
3. Time to Complete
Tracking the time it takes for users to complete a form - from when it loads to when they hit submit - can reveal a lot about how smooth or frustrating the process is. It highlights areas where users might be confused, stuck, or overwhelmed by overly complex fields.
Relevance to Form Performance Optimization
Analyzing completion times is key to understanding user behavior. For instance, if users abandon the form much faster than the average completion time, it could mean the form is confusing or the traffic source isn't attracting the right audience. On the flip side, if users quit after spending as much time - or more - than it typically takes to complete the form, the issue likely lies within the form itself.
Digging deeper with field-level tracking can uncover exactly where users are hesitating. If there's a noticeable pause on a particular field, it might mean the instructions or wording need to be clearer or simpler. These insights can directly lead to better conversion rates.
Impact on Conversion Rates
Reducing friction and streamlining the process can significantly improve conversion rates. Long completion times often correlate with higher abandonment rates, while very short sessions - under a minute - might suggest rushed, low-quality inputs.
Ease of Tracking and Actionable Insights
Modern form analytics tools make it easy to track session durations and identify problem areas, even down to specific fields. Comparing completion times across devices can also be revealing. For example, if mobile users take noticeably longer, it might mean the form layout isn’t mobile-friendly or that on-screen keyboards are causing issues. After making adjustments, keep an eye on time-to-complete metrics to ensure users are facing fewer obstacles.
4. Lead Quality Score
Boosting submissions without securing qualified leads can overwhelm your sales team. A lead quality score helps ensure your A/B test is drawing in valuable prospects - not just increasing numbers. This metric works alongside overall conversion tracking to balance quality with volume.
Relevance to Form Performance Optimization
Lead quality goes beyond basic conversion rates by focusing on the long-term value of your submissions. High conversion rates can sometimes be deceptive. For instance, if a form variant removes qualification questions to simplify the process, it might result in more submissions but attract less qualified leads. This can harm your bottom line, especially if those leads are tied to low-margin products or reduce overall profitability. Multi-step forms are a smart way to qualify leads effectively, as they identify key criteria without overwhelming users.
Impact on Conversion Rates
The average conversion rate across industries sits at 4.3%. However, a higher rate isn’t always a win if it’s driven by unqualified leads. Even when a form variant achieves strong conversions, its true value lies in bringing in prospects who progress through the sales funnel. Nick Donaldson, Senior Director of Growth at Knak, explains:
"High-quality leads are better indicators of success, as they reflect whether you're using the right advertising and marketing channels".
Ease of Tracking and Actionable Insights
You can track lead quality by linking your form data with your CRM system. Assign scores based on factors like demographics and user engagement - such as how thoroughly fields are completed or how much time users spend. Additionally, segment results by traffic source to differentiate between high-volume and high-quality leads. This method ensures you’re not just chasing numbers but identifying which form variations drive meaningful engagement.
5. Submission Volume by Traffic Source
Not all traffic sources perform the same way. Even if your overall numbers look solid, digging deeper into different channels - like paid search, social media, email, or organic traffic - can uncover key differences. By segmenting submission volume, you can pinpoint which audiences are genuinely engaging with your forms. This approach lays the groundwork for adjustments tailored to specific audience behaviors.
Relevance to Form Performance Optimization
Each traffic channel brings users with unique expectations and intent. For instance, someone who clicks on a well-targeted email campaign already has some context about your offer. On the other hand, a visitor from social media - especially if they’re encountering your brand for the first time - might need more convincing. Nick Donaldson, Senior Director of Growth at Knak, highlights this point:
"Different channels often have varying messaging and performance benchmarks, so breaking this data apart prevents high-volume channels from skewing test results."
By breaking down submission data by channel, you avoid drawing misleading conclusions. For example, a form design that resonates with email subscribers might completely miss the mark for social media visitors. This segmentation allows you to refine your approach for each audience, rather than relying on a one-size-fits-all solution.
Impact on Conversion Rates
When you analyze submission volume by source, you’ll also uncover which channels lead to better long-term conversion rates. Josh Gallant, Founder of Backstage SEO, explains:
"Comparing retention rates across audience segments can offer great insight into which types of audiences are the most likely to convert."
The average form conversion rate across industries is around 1.7%, but this number varies depending on the traffic source. Paid channels, for example, typically need a stronger connection between ad messaging and form content to keep conversions steady. Meanwhile, organic traffic often benefits from the trust already established with your brand, making those users more forgiving and patient.
Ease of Tracking and Actionable Insights
Tools like Google Analytics 4 and Amplitude make it easier to track form performance by channel. You can set up custom dimensions to break down metrics by campaign or traffic source. Additionally, tracking events such as "Form Starts" and "Form Completions" helps identify where audiences drop off. If submissions from one channel suddenly decline, it could signal issues like broken tracking links or mismatched messaging, rather than problems with the form itself. These insights, combined with other key data points, offer a complete picture of how your forms are performing.
sbb-itb-5f36581
6. Bounce Rate on Form Page
Once you’ve analyzed user submissions by traffic source, it’s time to take a closer look at how visitors initially interact with your form page. One key metric to focus on is bounce rate - the percentage of visitors who land on your page and leave without taking any action. While metrics like completion rate highlight how users engage with your form, bounce rate sheds light on the visitors who never even make it that far. This makes it an essential tool for diagnosing potential issues.
Why Bounce Rate Matters for Form Performance
A high bounce rate often signals problems on the page that discourage users from engaging with your form. As Josh Gallant, Founder of Backstage SEO, puts it:
"Bounce rate is a great indicator of the overall quality of your page, the content on it, and its UX."
Common reasons for high bounce rates include mismatched messaging - like when an ad promises one thing but the landing page delivers something else - and slow page load times. Katie Petriella, Content and SEO Specialist at Eppo, explains:
"A high bounce rate might indicate that users aren't finding what they expect, the content isn't engaging, or there are technical issues."
Improving bounce rate often involves tweaking the page itself - adjusting layouts, headlines, or load speeds - rather than modifying the form.
How Bounce Rate Affects Conversions
A high bounce rate can significantly cap your conversion potential. Visitors who leave without interacting represent missed opportunities before they even see your form. For context, the median conversion rate across industries is 4.3%, but this assumes visitors stay long enough to engage. Ensuring your landing page messaging aligns with the expectations set by traffic sources, like paid ads or organic search, is critical to keeping users engaged. Bounce rate works alongside other metrics to reveal where your landing page might need improvement.
Tools for Tracking and Actionable Insights
Platforms like Google Analytics 4 make it easy to track bounce rates by showing the percentage of single-page sessions with no interaction. Segmenting this data by traffic source can help identify which channels are underperforming.
To lower bounce rates, consider these steps:
- Speed up your page: Compress images and streamline your code to improve load times.
- Match your messaging: Ensure your page headline aligns with the promise that brought users there.
- Fix technical issues: Repair broken links and eliminate 404 errors to reduce visitor frustration.
If bounce rates remain high despite these efforts, try implementing exit-intent surveys to gather direct feedback. This can provide valuable insight into why visitors are leaving and help you make targeted improvements.
7. Conversion Rate to Opportunities
Conversion rate to opportunities measures how many form submissions turn into qualified sales leads. Essentially, it tracks the percentage of form completions that progress from initial interest to legitimate business opportunities. This shifts the focus from simply collecting email addresses to identifying prospects that are ready to generate revenue. In short, this metric directly connects form performance to revenue potential.
Why This Metric Matters for Form Optimization
A high form completion rate might look impressive at first glance, but it doesn’t mean much if those submissions don’t lead to valuable opportunities. For instance, you could see a spike in clicks with one form variant, but if those clicks don’t convert into meaningful leads, the changes weren’t actually effective. This is particularly important for B2B and SaaS businesses, where the sales cycle is often more complex and a form submission is just the starting point of a longer buyer journey. If an A/B test increases form submissions but reduces the rate at which they turn into opportunities, it could mean you’re attracting the wrong audience or creating false expectations. By keeping an eye on this metric, you ensure that your forms are driving real business value instead of just inflating surface-level numbers.
Quality Over Quantity: The Impact on Conversion Rates
Focusing on opportunity conversions rather than just raw submission numbers helps you zero in on quality leads. For example, if one form variant gets more clicks but fewer of those clicks turn into opportunities, it’s a sign that the engagement isn’t the kind you want. Enhancing the overall user experience can increase conversion rates significantly - up to 87% - allowing you to fine-tune your targeting and make better use of your ad budget.
How to Track and Act on This Metric
To track this effectively, connect your form analytics to your CRM. This will help you see which form variants are producing sales-qualified leads. You can also use conditional logic in your forms to ask qualifying questions, which helps reduce friction for high-potential leads. Keep in mind that tracking conversions to opportunities often requires a longer observation period - typically one to two weeks - to see which submissions turn into actual leads. And don’t make decisions prematurely; wait until your test results reach statistical significance (a p-value of 0.05) before acting. By integrating these practices, you can turn insights into meaningful improvements.
8. Abandoned Submission Rate
The abandoned submission rate is a crucial metric for identifying points of friction that prevent users from completing your form. It measures the percentage of users who start filling out a form but don't finish. Unlike the bounce rate, which tracks users who leave without engaging, this metric focuses on partial engagement. To calculate it, subtract the number of completed submissions from the number of form starts, divide by the total form starts, and multiply by 100.
Relevance to Form Performance Optimization
This metric is invaluable for uncovering what’s driving users away before they complete the form. Research shows that nearly 70% of users will abandon a form permanently if they encounter technical glitches or errors. Security concerns account for 29% of drop-offs, while 27% of users quit because the form feels overly long. Other factors, like intrusive ads or upselling attempts, cause 11% of users to stop midway. When conducting A/B tests, comparing abandonment rates between form variations can help you identify which design encourages users to complete the process. As Josh Gallant, Founder of Backstage SEO, notes:
"The greater the abandonment rate, the more likely it is that there are elements on your page causing friction".
This data allows for targeted adjustments to improve the user experience and drive completions.
Impact on Conversion Rates
Even a small reduction in abandonment rates can lead to a noticeable boost in conversions without increasing ad spend. For multi-step forms, tracking where users drop off at each step can pinpoint specific questions or sections that cause frustration. If users spend too much time on a particular field, it often signals unclear instructions or unnecessary complexity.
Ease of Tracking and Actionable Insights
To reduce abandonment rates, focus on simplifying the form experience. Limit required fields to only the essentials, especially for mobile users. Replace open-ended text fields with multiple-choice options when possible, as open fields tend to disrupt the flow by making users pause and think. Address security concerns by prominently displaying SSL certificates and clear privacy policies, which can reassure the 29% of users worried about data safety. For users about to exit, consider using exit-intent popups to capture minimal information like a name and email. Progress bars and encouraging messages like "You're almost there!" can also keep users motivated to complete the form. These strategies align with the broader insights from other metrics, offering a comprehensive approach to form optimization.
How Reform Helps Track These Metrics

Reform takes the guesswork out of monitoring and improving your forms by offering tools that keep you informed in real time. With its real-time analytics dashboard, you get an instant snapshot of key metrics like completion rates and abandoned submissions. No more waiting for third-party analytics tools to catch up - Reform lets you see how users interact with your forms during A/B tests as it happens. This immediate feedback allows you to spot problem areas, such as a specific field where users drop off, and make adjustments right away to avoid losing valuable conversions. It also provides detailed insights into drop-off points, helping you fine-tune your forms for better performance.
Reform’s abandoned submission tracking is another standout feature, capturing partial fills and offering side-by-side comparisons of abandonment trends across different form versions. For multi-step forms, this is especially useful - it helps pinpoint the exact step where users lose interest, so you can focus on fixing the issue and keeping users engaged.
The platform also integrates effortlessly with popular tools like HubSpot, Google Sheets, and Zapier, with Salesforce integration coming soon. These seamless integrations link your form submissions to business outcomes, showing not just how many people fill out your forms but also which traffic sources bring in the most promising leads. This insight helps you identify where your best opportunities are coming from and adjust your marketing efforts accordingly.
Reform goes further with its built-in A/B testing tools, which include statistical tracking to ensure your results are reliable. For example, you can compare how mobile and desktop users interact with your forms to see if certain layouts cause higher drop-off rates on smaller screens. Features like real-time validation and conditional routing make it easy to test different form flows while catching errors that might frustrate users and lead to abandonment. With these tools, you can refine every aspect of your forms and improve the user experience from start to finish.
Performance Comparison Table
When running A/B tests, raw metrics alone often don’t tell the full story. A performance comparison table offers a side-by-side breakdown of how your test variant measures up against the control across key metrics. This format makes it easier to spot trends and understand the impact of your changes.
Here’s an example of a performance comparison:
| Metric | Control (A) | Test Variant (B) | % Change | What It Means |
|---|---|---|---|---|
| Completion Rate | 4.5% | 5.8% | +28.9% | More users completing the form |
| Abandonment Rate | 65% | 52% | -20.0% | Fewer users dropping off mid-process |
| Lead Quality Score | 3.2/10 | 4.5/10 | +40.6% | Higher-intent leads entering the funnel |
| Submission Volume | 1,200 | 1,450 | +20.8% | Increased total form submissions |
| Cost Per Lead (CPL) | $15.00 | $12.50 | -16.7% | Improved cost efficiency |
The real value of this table lies in its ability to highlight both wins and trade-offs across multiple metrics. For instance, while a 28.9% increase in completion rate looks great, it’s crucial to also monitor lead quality scores to ensure you’re not just generating more low-value leads. This is why tracking secondary or "guardrail" metrics alongside your primary goals is so important - it helps avoid situations where short-term gains hurt long-term outcomes (think of it as patching one hole in a leaky bucket while ignoring others).
"Revenue per user is particularly useful for testing different pricing strategies or upsell offers. It's not always feasible to directly measure revenue, especially for B2B experimentation." - Alex Birkett, Co-founder, Omniscient Digital
This emphasizes the need to assess not just the quantity of leads but also their potential revenue impact. Keep in mind that only about one in seven A/B tests produces a clear winning variant. To ensure reliable results, tests should run for at least 1–2 weeks to hit the 95% confidence threshold, reducing the risk of random fluctuations skewing your data. Additionally, segmenting your results by traffic source or device type can uncover hidden trends - a variant might perform exceptionally well on mobile but fall flat on desktop, insights you’d miss if you only examined aggregate data.
Conclusion
Tracking the right metrics during form A/B testing helps you make decisions based on solid data. By keeping an eye on completion rates, abandonment points, lead quality, and conversion paths, you can identify where users are facing challenges and determine which changes deliver the best results.
Focusing only on submission volume might seem tempting, but it can overwhelm your pipeline with low-quality leads. Striking the right balance between quality and quantity ensures steady, reliable growth over time.
Testing isn’t about quick wins - it requires patience and careful measurement. Running experiments for at least 1–2 weeks and breaking down data by traffic source or device type can uncover trends and insights that might be hidden in overall numbers.
Understanding these metrics is crucial for form optimization, and this is where Reform shines. With real-time analytics and tools to track abandoned submissions, Reform simplifies the process of monitoring key metrics without needing multiple platforms. Its built-in A/B testing features let you compare form variations side-by-side, tracking everything from field-level drop-offs to lead quality scores. Plus, seamless CRM integrations allow you to follow leads through your entire sales funnel, helping you measure what truly drives revenue.
Start small - focus on one or two key metrics. Even minor, consistent improvements can lead to major results over time.
FAQs
What is the most important metric to track during form A/B testing?
When conducting form A/B testing, the conversion rate stands out as the key metric to monitor. This figure represents the percentage of visitors who successfully fill out and submit the form, offering a clear indication of how well your form drives user action.
Focusing on conversion rates allows you to pinpoint which adjustments in design, wording, or layout resonate most with your audience. Keeping an eye on this metric helps ensure your efforts are geared toward improving engagement and generating more qualified leads.
What are the best ways to increase form completion rates?
To increase form completion rates, focus on simplifying the process. Keep the number of fields to a minimum, asking only for the most necessary information. A clean, mobile-friendly design with plenty of white space makes navigation easier and less overwhelming. Including trust signals, such as security badges and clear privacy policies, can help reassure users and encourage them to follow through. Tools like conditional logic and multi-step forms can also enhance the experience by showing users only the questions that are relevant to them.
After optimizing your form, make testing and refinement a regular practice. Conduct A/B tests on elements like headlines, button text, or the order of fields to pinpoint what resonates most with your audience. Use real-time analytics to monitor metrics like views, submissions, and abandonment rates, and tweak your approach based on the data. Even small, consistent adjustments can significantly improve conversions and strengthen your marketing results.
Why is lead quality more valuable than just getting more form submissions?
Focusing on lead quality rather than just chasing a high number of submissions is key to driving real results. High-quality leads are those that closely match your target audience. They tend to move through the sales funnel much quicker, are more likely to convert into paying customers, and often bring greater lifetime value. This approach doesn’t just improve your conversion rates - it also helps lower your cost per acquisition and increases your overall ROI.
In contrast, chasing a high volume of generic submissions might make your metrics look good on paper, but it often leads to wasted time and resources. Low-intent leads rarely convert, creating inefficiencies for your sales team and driving up marketing expenses. To avoid this, design your forms with intent and relevance in mind. Features like multi-step layouts, conditional logic, and real-time analytics can help you attract leads that truly matter, ensuring your efforts are focused on prospects who will genuinely benefit your business.
Related Blog Posts
Get new content delivered straight to your inbox

The Response
Updates on the Reform platform, insights on optimizing conversion rates, and tips to craft forms that convert.


Drive real results with form optimizations
Tested across hundreds of experiments, our strategies deliver a 215% lift in qualified leads for B2B and SaaS companies.
