
.webp)
Top Metrics For Validating Predictive Scoring Models


Creating a predictive scoring model is only the beginning. Validating its performance is what ensures it drives meaningful results. This article breaks down the most effective metrics for evaluating lead scoring models, focusing on their practical application in sales and marketing.
Here’s a quick summary of the key metrics:
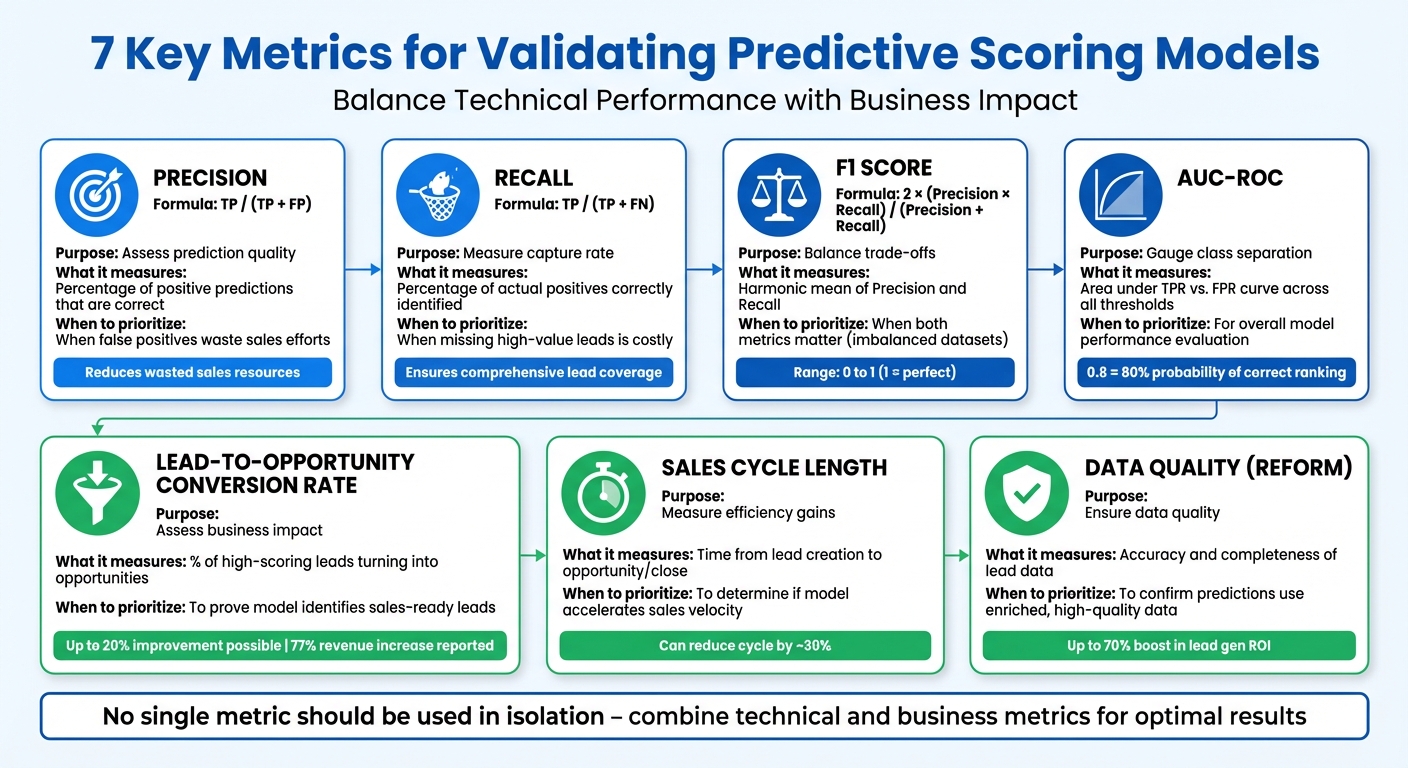
- Precision: Measures the accuracy of positive predictions. High precision reduces wasted sales efforts.
- Recall: Evaluates how well the model identifies all high-value leads. Useful when missing leads is costly.
- F1 Score: Balances precision and recall, providing a single performance measure for imbalanced datasets.
- AUC-ROC: Assesses the model's ability to differentiate between high- and low-value leads across all thresholds.
- Lead-to-Opportunity Conversion Rate: Links scoring accuracy to actual sales outcomes, ensuring leads convert into opportunities.
- Sales Cycle Length: Tracks how quickly high-scoring leads move through the pipeline, reflecting efficiency.
- Data Quality (Reform): Ensures predictions are based on enriched, accurate, and complete data.
Each metric serves a specific purpose, from improving technical accuracy to aligning predictions with business goals. By combining these, you can refine your model and maximize its impact on revenue growth.
7 Key Metrics for Validating Predictive Scoring Models
1. Precision
Precision measures how many of the leads predicted as high-quality actually are high-quality. The formula is simple: True Positives / (True Positives + False Positives). For instance, if 100 leads are classified as high-quality and 80 of them turn out to be correct, the precision is 80%.
This metric answers an essential question: How reliable are the positive predictions? Jason Brownlee from MachineLearningMastery.com explains it well:
Precision evaluates the fraction of correct classified instances among the ones classified as positive.
Precision is especially critical when false positives come with a high price. Misclassifying low-value prospects as high-quality can waste sales resources and, over time, diminish trust in the scoring system.
To improve precision, you can raise the classification threshold. However, this often reduces recall, so it's vital to align this trade-off with your team's capacity and priorities.
| Metric Component | Description | Sales Impact |
|---|---|---|
| True Positive (TP) | High-quality leads correctly identified | Allows focus on genuine opportunities |
| False Positive (FP) | Low-value prospects misclassified as high-quality | Wastes time on non-viable leads |
| Precision Formula | TP / (TP + FP) | Higher precision reduces wasted effort |
Up next: a closer look at recall and how it complements precision.
2. Recall
Recall is a metric that tells you how effectively your model identifies high-value leads. It's calculated using the formula: True Positives / (True Positives + False Negatives). For instance, if you have 100 qualified prospects in your database and your model correctly identifies 85 of them, your recall rate would be 85%.
As Google for Developers explains:
Recall measures the ability of the model to correctly identify all positive instances.
This metric becomes critical when missing out on high-value opportunities carries a significant cost. In such cases, ensuring that your model captures as many qualified leads as possible outweighs the inconvenience of reviewing a few unqualified ones. Wikipedia sums up this trade-off well:
High recall means that an algorithm returns most of the relevant results (whether or not irrelevant ones are also returned).
To increase recall, you can lower the classification threshold. This means your model will flag more leads as "high-value", casting a wider net. While this approach ensures your sales team reviews more potential opportunities, it also increases the likelihood of false positives - leads that may not actually be high-quality. This strategy works best if your team has the bandwidth to evaluate a larger pool of leads and when comprehensive coverage is the priority.
| Outcome | Definition in Lead Scoring | Impact on Recall |
|---|---|---|
| True Positive (TP) | A qualified lead correctly flagged as high-value | Increases Recall |
| False Negative (FN) | A qualified lead mistakenly flagged as low-value | Decreases Recall |
| False Positive (FP) | An unqualified lead mistakenly flagged as high-value | No direct impact on Recall |
3. F1 Score
The F1 score is a metric that combines precision and recall into a single value, offering a balanced perspective on a model's performance. It’s calculated using the formula: 2 × (Precision × Recall) / (Precision + Recall). This approach ensures that neither precision nor recall overshadows the other in the evaluation process.
Here’s an example: Imagine a model with 90% precision but only 20% recall. At first glance, the precision might make the model seem impressive. However, the F1 score - just 33% in this case - paints a more realistic picture of its overall effectiveness. This shows how mismatched precision and recall can significantly lower the F1 score.
A strong F1 score suggests the model does a good job of minimizing both false positives and false negatives. In practical terms, this means it can reliably identify high-potential leads while avoiding false alarms.
F1 scores range from 0 to 1. A lower score highlights poor alignment between precision and recall, as the harmonic mean skews toward the weaker of the two metrics. This is especially important for imbalanced datasets, where accuracy alone can give a misleading impression of performance. On the other hand, a perfect F1 score of 1 means the model has no false positives or false negatives.
The F1 score is particularly useful when both types of errors are costly. For example, in sales, false positives waste resources on uninterested leads, while false negatives result in missed opportunities. If one type of error is more critical than the other, consider using the F‑beta score instead. For instance, the F2 score prioritizes recall, while the F0.5 score places more weight on precision.
4. AUC-ROC (Area Under the Receiver Operating Characteristic Curve)
The AUC-ROC, or Area Under the Receiver Operating Characteristic curve, is a metric that evaluates how effectively your predictive model can distinguish between high-value and low-value leads across all possible thresholds. Unlike precision and recall, which focus on specific cutoffs, AUC-ROC looks at performance across the entire range of thresholds.
Essentially, it reflects the likelihood that a high-value lead will be ranked higher than a low-value one. For example, an AUC score of 0.8 means the model has an 80% chance of correctly ranking a converting lead above a non-converting one. A perfect score of 1.0 indicates flawless classification, while a score of 0.5 suggests the model is no better than random guessing. This makes AUC-ROC a reliable way to compare models on an equal footing.
"The area under the ROC curve (AUC) represents the probability that the model, if given a randomly chosen positive and negative example, will rank the positive higher than the negative." – Google for Developers
AUC-ROC is often considered the go-to metric for comparing scoring models because it provides an overall measure of performance that doesn’t depend on a preselected threshold.
The ROC curve itself can also help you decide on the best threshold for your specific needs. If missing high-value leads is a big concern, aim for a higher true positive rate. On the other hand, if false positives create unnecessary work for your sales team, focus on achieving a lower false positive rate. When dealing with datasets that have very few converting leads, it’s a good idea to pair AUC-ROC with Precision-Recall curves for a more thorough assessment.
5. Lead-to-Opportunity Conversion Rate
The lead-to-opportunity conversion rate measures how many high-scoring leads turn into qualified opportunities. In simpler terms, it connects the effectiveness of your predictive scoring model to actual sales outcomes, ensuring that the leads identified as high-value are translating into actionable opportunities.
For context, B2B conversion rates usually fall between 3% and 5%. Predictive scoring has the potential to improve these rates by up to 20%. That’s a game-changer, especially considering that sales teams often spend up to 40% of their time chasing leads that don’t pan out. Companies that have implemented predictive scoring report seeing revenue increases as high as 77% from their marketing efforts.
"Knowing how accurate a predictive scoring model is... helps you convince your leadership team and sellers to adopt the model for improved business outcomes." – Microsoft Dynamics 365
To make the most of this metric, define a clear success window - like focusing on leads that convert within 60 days - and use your CRM to monitor transitions. If you notice incomplete records or leads consistently failing to convert, it could be a sign of model drift. This means your scoring attributes or the data feeding the model may need a refresh. Pay attention to patterns in lead behavior, such as whether downloading a pricing guide is more predictive of conversion than reading a blog post.
Set specific goals - like aiming for a 20% boost in SQL-to-opportunity conversion rates - and keep an eye on performance. If the numbers start slipping, it’s time to audit your model. This metric not only validates your scoring model’s technical accuracy but also lays the groundwork for evaluating broader sales metrics, such as the length of your sales cycle.
sbb-itb-5f36581
6. Sales Cycle Length
Sales cycle length tracks the time it takes to move from identifying a lead to closing the deal. It's a key indicator of how well your scoring model identifies leads that are ready to buy now versus those that need more nurturing. In short, it connects your model's predictions to the actual efficiency of your sales process.
Predictive scoring helps focus on leads that are likely to close quickly. If high-scoring leads still take a long time to close, it could mean your model is misinterpreting their behavior. A well-tuned model can often reduce the overall sales cycle by about 30%.
"Sales cycle duration... shows if higher-scored leads close faster." – CallingAgency
To validate this metric, compare the average sales cycle length for high-scoring leads with that of low-scoring ones. A noticeable difference confirms that your model is effectively predicting which leads are closer to making a purchase.
You can dig deeper by analyzing how long high-scoring leads spend in each stage of your sales process. Ideally, these leads should move through the pipeline faster, from initial contact to closing, with fewer interactions. Use your CRM to flag these high-priority leads for immediate follow-up, ensuring your team focuses on the right opportunities and avoids wasting time on leads that are unlikely to convert.
7. Reform (for lead enrichment and validation)

Every predictive scoring model is only as good as the data it relies on. Without accurate, high-quality data, even the most advanced models can stumble. Data quality hinges on four key pillars: completeness, accuracy, recency, and consistency. When data is missing, outdated, or riddled with inconsistencies, it skews predictions and drains resources.
Reform addresses these challenges head-on with tools for lead enrichment, email validation, and spam prevention. Its lead enrichment feature enhances your database by automatically adding accurate demographic and firmographic details. This means you can streamline your forms - asking for just an email address and company name, for example - while Reform fills in the gaps, providing details like job titles, company size, and industry. This approach not only improves the user experience but also ensures your data is complete and ready for predictive analysis.
Email validation and spam prevention go a step further by filtering out fake entries and bounced emails. These tools ensure your predictive models are trained on legitimate, high-quality data from users who show genuine interest. By eliminating bad data, you maintain a clean database and improve the reliability of your scoring models.
The impact of clean, enriched data is significant - it can boost lead generation ROI by up to 70%. Instead of relying on incomplete profiles or spammy submissions, your models are built on a foundation of verified, enriched data that reflects real buying intent.
Comparison Table
To properly evaluate your predictive scoring model, it's essential to align its technical performance with your business objectives. The table below highlights key metrics to help streamline your validation process.
| Metric | Primary Purpose | What It Measures | When to Prioritize |
|---|---|---|---|
| Precision | Assess prediction quality | Percentage of positive predictions that are correct | When false positives lead to wasted sales efforts |
| Recall | Measure capture rate | Percentage of actual positives correctly identified | When missing high-value leads could significantly impact outcomes |
| F1 Score | Balance trade-offs | Harmonic mean of Precision and Recall | When both metrics matter, especially with imbalanced classes |
| AUC-ROC | Gauge class separation | Area under the TPR vs. FPR curve across all thresholds | To evaluate overall model performance without focusing on specific thresholds |
| Lead-to-Opportunity Conversion Rate | Assess business impact | Percentage of high-scoring leads turning into opportunities | When proving the model identifies "sales-ready" leads that move through the funnel |
| Sales Cycle Length | Measure efficiency gains | Time from lead creation to opportunity or close | To determine if the model shortens the sales process and accelerates velocity |
| Reform | Ensure data quality | Accuracy and completeness of lead data | To confirm predictions are based on enriched, high-quality data |
This table offers a straightforward guide to connect performance metrics with your sales and business goals effectively.
Conclusion
Building an effective predictive scoring model hinges on using multiple metrics. As John H. Cabot, MD, from Stanford University School of Medicine, wisely points out:
No single metric should be used in isolation to evaluate the performance of a clinical prediction model.
This principle holds true for lead scoring as well. Relying solely on accuracy can be misleading, especially when dealing with imbalanced datasets.
Metrics like precision, recall, and F1 score each highlight different aspects of a model's performance, while AUC-ROC provides a broader view of how well the model distinguishes between quality and low-quality leads across thresholds. However, there’s always a trade-off: boosting precision often comes at the cost of recall, and vice versa.
Validation isn't just a technical exercise - it has real business implications. By focusing on the right metrics for your specific needs, you help your sales team focus on high-quality leads and avoid wasting time on poor prospects. For teams with limited capacity, prioritizing precision ensures every lead counts. On the other hand, if missing out on high-value leads is costly, optimizing for recall might be the better approach.
But technical performance alone doesn’t guarantee business success. As Elsie Gyang Ross, MD, reminds us:
High model performance does not equate to usefulness.
Metrics like lead-to-opportunity conversion rates and sales cycle length are critical because they show whether the model is actually driving better decisions and resource allocation.
To get the most out of your predictive scoring model, start with a thorough validation process. Combine metrics like AUC-ROC, precision-recall analysis, and measures of business impact. Tools like Reform can help by ensuring your predictions are grounded in enriched, high-quality data. When technical precision aligns with actionable business insights, your scoring model can turn raw lead data into measurable revenue growth.
FAQs
How do I find the right balance between precision and recall in my predictive scoring model?
Balancing precision - the percentage of correctly predicted leads out of all predicted leads - and recall - the percentage of actual convertible leads captured - often hinges on adjusting the model’s probability threshold. Lowering the threshold can boost recall by capturing more leads, but it may also lower precision by including less-qualified prospects. On the flip side, increasing the threshold improves precision but might result in missing valuable opportunities.
To strike the right balance, use a validation dataset to analyze the precision-recall curve. This helps identify the threshold that best aligns with your business objectives. You can also optimize for a combined metric like the F1 score, which gives equal importance to both precision and recall. If recall holds greater importance for your goals, consider using an Fβ score, which allows you to give more weight to recall. Adjust the threshold iteratively, evaluate the results, and select the setting that fits your priorities. Once fine-tuned, these scores can inform lead-routing strategies, helping to improve lead quality and boost conversion rates.
Why is AUC-ROC important for evaluating predictive models?
AUC-ROC is an important metric for evaluating how well a binary predictive model separates positive cases from negative ones. What makes it stand out is that it offers a threshold-independent way to measure performance, assessing the model's accuracy across all possible classification thresholds.
The AUC (Area Under the Curve) score falls between 0 and 1. Scores closer to 1.0 reflect better performance, showing the model's strength in distinguishing between classes. A higher AUC-ROC score indicates a more reliable model, making it an essential tool for validating predictive lead scoring models.
Why is high-quality data essential for predictive lead scoring models?
High-quality data is the backbone of predictive lead scoring models. The model's accuracy hinges on the quality of the information it processes. If the data is incomplete, inaccurate, or cluttered with noise, it can skew the connection between a lead's behavior and their likelihood to convert. This often results in unreliable predictions and weaker performance on metrics like precision, recall, and the F1 score.
Clean, accurate, and well-structured data minimizes errors like false positives and false negatives. This allows the model to detect meaningful patterns and provide dependable results. Tools like Reform play a crucial role by capturing validated and enriched lead data - such as verified email addresses and spam-free inputs - right from the beginning. With only high-integrity data entering the scoring process, businesses can achieve better model accuracy, higher conversion rates, and make smarter decisions backed by reliable validation metrics.
Related Blog Posts
Get new content delivered straight to your inbox

The Response
Updates on the Reform platform, insights on optimizing conversion rates, and tips to craft forms that convert.


Drive real results with form optimizations
Tested across hundreds of experiments, our strategies deliver a 215% lift in qualified leads for B2B and SaaS companies.
