
.webp)
Best Practices for CRM API Error Logging


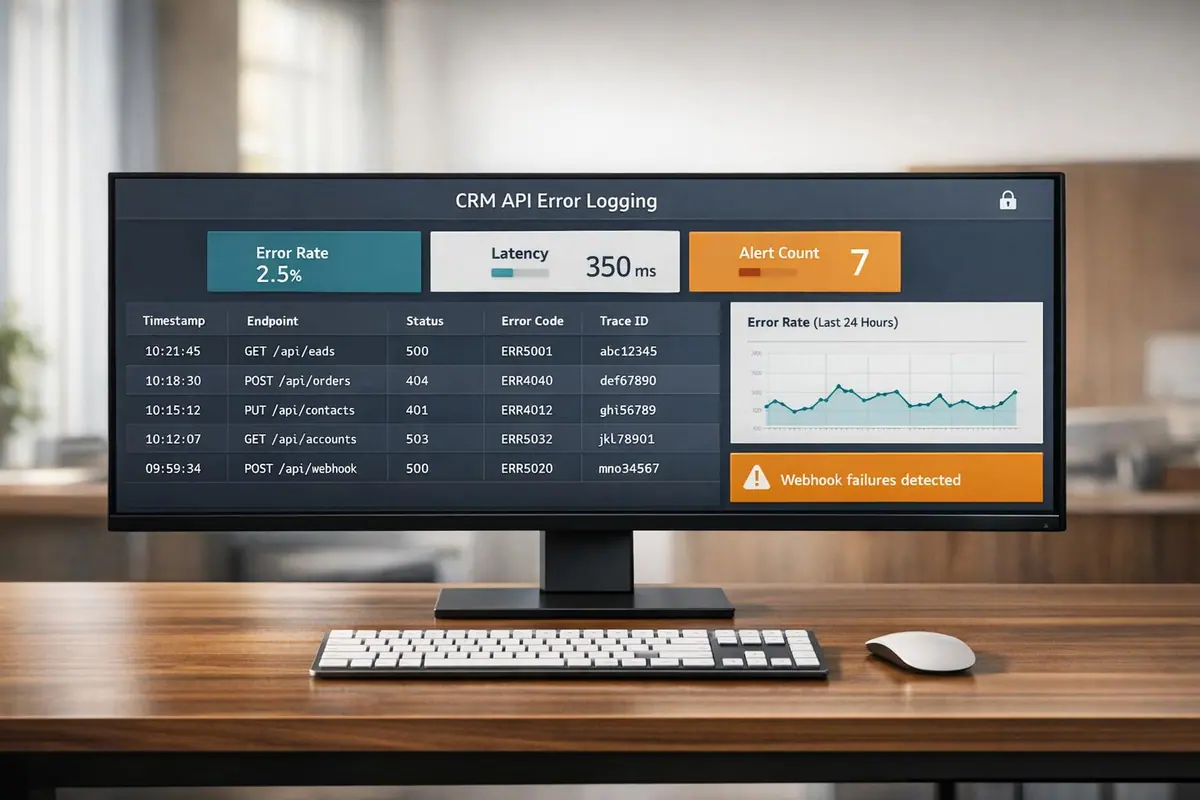
When CRM systems connect with external tools, errors like failed syncs, expired tokens, or validation issues can quietly disrupt data. Logging these errors systematically helps identify and resolve problems faster, ensuring data accuracy and smoother integrations.
Key takeaways:
- Why it matters: Silent sync errors can go unnoticed, impacting data quality. A 2026 survey found only 8% of B2B professionals rated their CRM data quality as excellent.
- Common issues: Expired tokens (401 errors), rate limits, and schema mismatches are frequent causes.
- What to log: Include machine-readable error codes, correlation IDs, HTTP methods, and detailed field-level validation errors.
- Log structure: Use structured JSON with clear formatting for easy analysis. Mask sensitive data like passwords or PII.
- Scalability: Centralized logging systems with asynchronous logging, retention policies, and error classification improve efficiency.
- Metrics to track: Monitor sync success rates, error categories, and data latency to catch and fix issues early.
How to Add Custom Function Error Logs to Zoho CRM with Email Alerts
sbb-itb-5f36581
Key Elements of Effective Error Logging
Effective error logging helps reduce downtime by offering clear, actionable insights into integration issues.
What Data to Capture in Logs
To diagnose issues effectively, a log entry needs to provide detailed context. Relying on just an HTTP status code and timestamp won’t cut it.
Each log entry should include a machine-readable error code (e.g., CONTACT_UPDATE_DUPLICATE_EMAIL) rather than generic HTTP codes. Adding a unique correlation ID (requestId) is crucial for tracing transactions across services. Other essential details include the HTTP method, endpoint path, response time in milliseconds, and metadata like User ID and resource type (e.g., "Contact" or "Account").
For validation errors, such as HTTP 400 or 422, logs should include an array of field-level details. This means specifying the field name, the problem (e.g., REQUIRED or TOO_SHORT), and the expected value. These details can significantly cut down the time it takes to diagnose errors. In fact, internal estimates suggest that high-quality diagnostic data can reduce the mean time to diagnose (MTTD) by over 80%.
| Field | Description | Example |
|---|---|---|
code |
Stable machine-readable error code | CONTACT_UPDATE_DUPLICATE_EMAIL |
requestId |
Unique correlation ID | req_f47ac10b |
latencyMs |
Time to process the request | 145 |
field |
Specific field that failed | emailaddress1 |
instance |
URI for the specific error | /errors/a1b2c3d4 |
Log Structure and Format Best Practices
Once you know what data to capture, structuring logs properly ensures they’re easy to read and analyze. Structured JSON logs are a great choice because they provide a clear hierarchy, are filterable, and work well with most tools.
"The difference between resolving an incident in minutes vs. hours often comes down to one thing: Structured logging that tells a story." - Trailonix
Here are some tips for better log formatting:
- Use dot notation for nested attributes (e.g.,
user.id,request.duration_ms) to maintain a clear hierarchy. - Start each log message with a verb like "Failed", "Created", or "Validated" for quick readability.
- Keep the message string static and store variable data (like
orderIdoramount) in a separate metadata object. This makes it easier for tools to group identical events without misclassifying them as unique.
For teams working with external partners or in regulated industries, adopting RFC 7807 ("Problem Details for HTTP APIs") can be a game-changer. It defines a consistent JSON schema with fields like type, title, status, detail, and instance, making logs easier to parse by external SDKs and API gateways.
Finally, it’s critical to safeguard your logs against exposing sensitive data.
Protecting Sensitive Data in Logs
Around 15% of integrations unintentionally log sensitive data like passwords or API keys. This poses a serious security risk, especially when logs are shared with third-party aggregators or stored for extended periods.
"Sensitive data (passwords, authentication tokens, PII, health data, financial identifiers) should never appear in logs. Not masked later - never logged in the first place." - Databuddy
The best approach is to use an allowlist: instead of logging entire request or response objects, specify exactly which fields are safe to include (e.g., method, path, user_id). For debugging purposes, you can log truncated identifiers for API keys or tokens - such as the last four characters. Mask sensitive data like emails, phone numbers, or names with placeholders like [REDACTED] or [EMAIL]. This ensures the log structure remains intact while keeping sensitive information hidden.
For CRM logs, a practical retention policy could be 90 days for detailed logs and 1 year for aggregated security metrics. This timeframe is long enough to address most breach detection needs without retaining sensitive data indefinitely.
Designing a Scalable Logging Strategy
As your CRM integrations grow, having a scalable logging strategy becomes critical. A system that works for a few API calls can quickly become inadequate as the complexity of your integrations increases. Planning for scalability from the beginning can save you from significant headaches later - especially when you hit the "10 integrations" inflection point. At this stage, the lack of standardization can consume up to 40% of engineering time on maintenance. A well-thought-out logging approach reduces maintenance efforts and boosts CRM reliability.
Log Levels and When to Use Them
Using log severity levels appropriately ensures your logs are helpful rather than overwhelming.
"Log levels are a contract with Future You and whoever gets paged at 3 AM because the batch job exploded." - Seth Black
Here’s a breakdown of the five standard log levels and their purposes:
| Level | When to Use It |
|---|---|
| DEBUG | For development only - track variable values, function arguments, and cache hits. |
| INFO | Log API requests, user actions, and business events like "Contact created." |
| WARNING | Highlight handled issues, such as retries after timeouts or disk usage nearing capacity. |
| ERROR | Record failed operations needing attention, like exceptions or validation errors. |
| CRITICAL | Log system-level failures, such as database outages or service crashes. |
In practice, production logging should default to INFO or WARNING, while DEBUG is reserved for local development or brief troubleshooting sessions. A helpful trick is to configure loggers to adjust their level based on an environment variable. This allows you to increase verbosity during incidents without restarting the service.
Logging Configurations by Environment
Each environment - development, staging, and production - requires a tailored logging configuration. In development, verbose DEBUG logs are useful for tracking CRM writes and field mapping. However, in production, this level of detail can overwhelm the system and slow performance, especially if logging is synchronous. To address this, implement asynchronous logging and set up automated log rotation. For example, compress logs older than 30 days or larger than 50MB to manage storage effectively.
Retention policies also play a key role. A tiered approach works well: retain error logs for 90 days but delete debug logs after 7 days to keep storage costs under control.
Centralized Log Management
Relying on siloed, disk-based logs isn’t a viable long-term solution.
"Individual log files per service, written to disk, are not a logging system. They're a precondition for one." - Temitope Bamidele
A centralized logging system typically includes a log shipper (like Promtail or Filebeat), an optional message queue (like Kafka) to handle traffic spikes, and a scalable storage backend. For example, Elasticsearch is ideal for complex analytical queries, while Loki offers a cost-efficient option for operational monitoring by indexing metadata labels instead of full log text.
Planning your log routing early is crucial. Using sinks or drains, you can direct error logs to alerting systems, send raw payloads to encrypted storage for compliance, and forward aggregated metrics to BI tools for analysis. This approach ensures your monitoring dashboards remain clean while satisfying audit and compliance needs - without duplicating storage unnecessarily.
Next, we’ll explore how to apply this strategy directly within your CRM API code.
Implementing Error Logging in CRM API Code
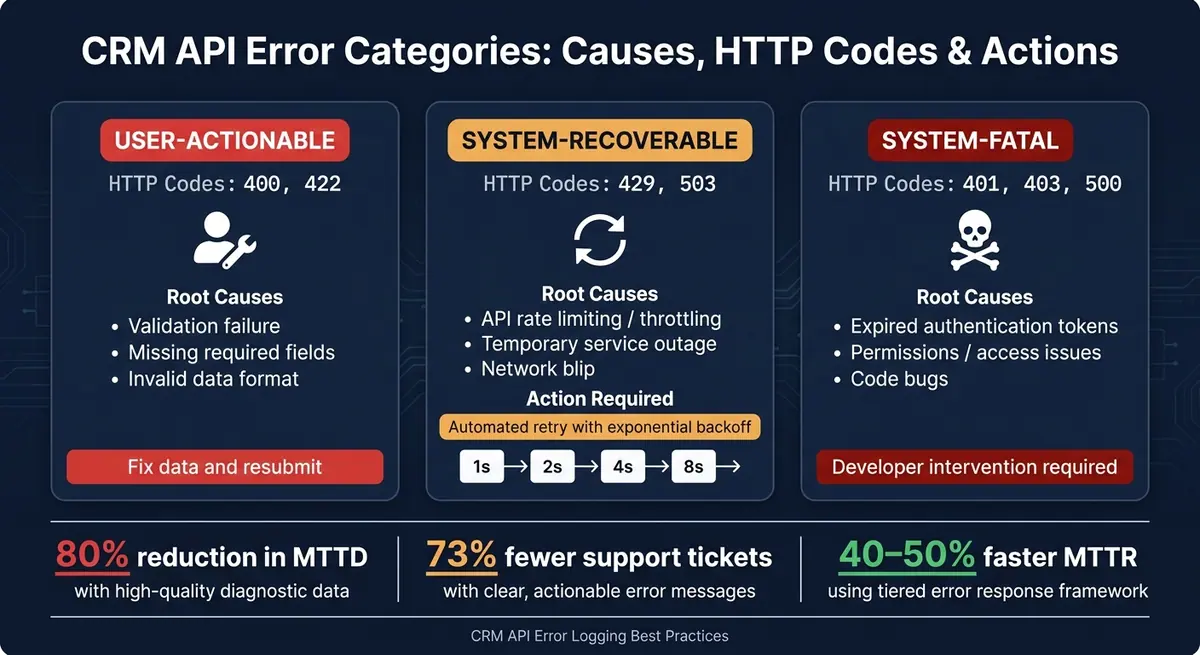
CRM API Error Categories: Causes, HTTP Codes & Actions
Integrating error logging into your CRM API code is a practical step toward better real-time issue detection. This is where theoretical strategies meet real-world application, and even small decisions can significantly impact your ability to troubleshoot production problems effectively.
Logging API Calls and Responses
Every CRM API call should generate a structured JSON log entry. Include essential details like request_id, user_id, ip_address, attempt_duration_ms, and the HTTP status code. These elements provide the context needed to piece together the full transaction.
A helpful practice is using correlation IDs - unique identifiers assigned at the start of a process and carried through every downstream interaction. For instance, when a lead submission moves from your capture tool to middleware and finally lands in the CRM, a single correlation ID links all related log entries. Without this, debugging often devolves into manually matching timestamps - a time-consuming process.
For retries, make sure to log each attempt, including the delay and outcome. If you’re using exponential backoff (e.g., delays of 1s, 2s, 4s, 8s for HTTP 429 or 503 errors), note the attempt number and the specific error code that triggered the retry. This level of detail helps distinguish between temporary network glitches and persistent upstream issues.
Handling Validation and Mapping Errors
Structured logging for API calls pairs well with robust data validation. Always validate data before sending it to the CRM. By catching validation errors early, you can avoid unnecessary network traffic and produce cleaner logs. For example, ensure required fields like email and phone numbers are present, verify data types, and normalize formats (e.g., ISO 8601 for dates, E.164 for phone numbers) before making the API call.
When validation fails, log the exact field and error message (e.g., Field "industry" is required). Ambiguous error logs can lead to a 73% increase in support tickets compared to clear, actionable messages.
To make logs more searchable, adopt a structured naming convention for error codes, such as DOMAIN_ACTION_REASON (e.g., LEAD_CREATE_INVALID_EMAIL). This format allows for instant filtering and helps build targeted alerts without parsing free-text messages.
| Error Category | HTTP Code | Root Cause | Action Required |
|---|---|---|---|
| User-Actionable | 400, 422 | Validation failure, missing fields, invalid format | Fix data and resubmit |
| System-Recoverable | 429, 503 | Throttling, temporary outage, network blip | Automated retry with backoff |
| System-Fatal | 401, 403, 500 | Expired tokens, permissions issues, code bugs | Developer intervention |
Logging Lead Data from Capture Workflows
Lead capture workflows bring their own logging challenges. For example, when a form submission arrives via a tool like Reform, the intake handler should immediately save the raw payload to an encrypted store and return an HTTP 200 response. The actual CRM write should then happen asynchronously in a background worker. This approach avoids webhook timeouts and ensures no submissions are lost.
"The moment you add multiple webhook sources or you care about sub-5-minute follow-up SLAs during outages, the queued architecture pays for itself." - ThinkBot Agency
Each log entry for a lead submission should include the form identifier, submission ID, an idempotency key (to prevent duplicate CRM records on retried webhooks), and the enrichment status (e.g., whether email verification or LinkedIn profile checks were completed). If enrichment fails midway, logging each step helps pinpoint where the issue occurred, rather than leaving you with incomplete contact records.
For submissions that fail after all retry attempts, move them to a dead-letter queue (DLQ) and log the full failure context. Monitoring the DLQ can serve as an early warning system - a sudden increase often points to a schema change in the form or a breaking update on the CRM side. Detailed logs for these failures ensure no anomaly slips through the cracks, feeding back into your central error analysis system for a complete picture.
Monitoring and Improving CRM API Error Logs
Once your logging infrastructure is in place, the next step is to keep a close eye on the logs and take action as needed. This helps you address critical issues promptly while identifying patterns in integration problems.
Key Metrics to Track for CRM Error Monitoring
Start by tracking the sync success rate, which serves as a primary indicator of integration health. Pair this with the last successful sync timestamp to catch silent failures - cases where data stops flowing without any explicit errors being logged. If no sync occurs during business hours for an extended period, it’s a red flag.
Break down your error rate by categories like authentication issues, rate limits, validation errors, or server problems. This helps you respond appropriately - handling a 401 error (authentication failure) is very different from managing a 429 error (rate limit). Another crucial metric is data latency, especially for workflows like lead management and enrichment. Studies show that a 30-minute delay in lead data processing can reduce qualification odds by 21 times compared to a 5-minute response.
Here’s a quick reference table for key metrics:
| Metric | Why It Matters |
|---|---|
| Sync Success Rate | Tracks overall integration health |
| Last Successful Sync | Identifies silent failures |
| Error Rate by Category | Helps isolate technical vs data-related issues |
| Data Latency | Measures how quickly records are processed |
| Queue Depth | Detects backlogs before they disrupt operations |
Setting Alerts for Critical Errors
Once you’re tracking these metrics, configure alerts to focus on critical issues rather than flagging every minor error. For example, set alerts when non-200 HTTP responses exceed 1% over five minutes or when API latency goes beyond 500ms for 10 minutes. Immediate alerts should be reserved for 401 and 403 errors, as these require manual intervention to resolve authentication problems.
A tiered response framework can streamline error management:
- Tier 1 handles transient errors (e.g., 5xx or 429) with automated retries using exponential backoff.
- Tier 2 addresses technical issues like malformed data or mapping failures.
- Tier 3 focuses on business process errors, such as exceeding a credit limit, requiring manual intervention.
This tiered approach can cut the mean time to resolution (MTTR) by 40–50% in just three months. Always route technical alerts to engineering teams and business-related errors to sales operations to avoid miscommunication. Implementing expert form strategies can further ensure that data captured at the source is clean and correctly routed.
Regular Log Review and Optimization
Scheduled log reviews are essential for spotting recurring issues and preventing systemic failures. Focus on the most frequent errors - about 80% of problems often stem from the top 10 issues, making this a more efficient use of time.
These reviews also help identify schema drift, where upstream changes disrupt downstream workflows. For example, in 2026, a mid-market company found that a schema change caused a "Region" field to sync as a numerical ID instead of text. Although the API still returned a 200 OK status, leads were routed to the wrong sales territories for three weeks, resulting in a 25% drop in speed-to-lead and an estimated $80,000 in lost pipeline.
Regular reviews also allow you to refine error classifications and update your runbook with solutions to known issues. This ensures that on-call team members have a clear roadmap instead of starting from scratch.
"A monitoring system built for last quarter's reality will inevitably develop blind spots." - AeroLeads
Conclusion
Error logging plays a critical role in maintaining reliable CRM integrations and ensuring accurate data. As GTMStack aptly notes: "Bad CRM data isn't usually a CRM problem. It's an integration problem." The strategies outlined here provide the tools to identify issues early, address them quickly, and prevent silent failures from eroding trust in your CRM system.
Key Takeaways
The biggest shift is moving from a reactive approach to a proactive one. Silent failures - where your system gives a 200 OK response but quietly loses data - can linger unnoticed for weeks. Using structured JSON logs with correlation IDs, along with alerts for unexpected silence, is your first line of defense against these issues.
Here are some guiding principles to keep in mind:
- Standardize error formats across all CRM platforms by adopting a normalized error envelope. Whether you're dealing with Salesforce JSON or SAP XML, this ensures consistency in debugging.
- Classify errors based on recoverability - distinguishing between retryable errors (e.g., 429, 5xx) and permanent ones (e.g., 400, 403). This allows your system to automatically handle retryable issues while escalating permanent ones immediately.
- Safeguard sensitive data by hashing PII in idempotency keys and encrypting raw payloads at rest. This is especially important for industries with strict regulations.
These practices directly enhance operational efficiency and improve support outcomes. Teams adopting this approach have seen measurable improvements: integration incidents are resolved in an average of 4 hours instead of 3.2 business days, and error-related support tickets drop by 73%.
"An integration without monitoring is an integration you won't know is broken until someone complains." - GTMStack
If you're just starting, focus on small, impactful steps - standardize your log format, implement a dead-letter queue, and set up a single alert for authentication failures. From there, refine and expand your monitoring strategy. The goal isn't perfection; it's achieving better visibility and control.
FAQs
How do I design stable error codes for CRM sync failures?
When designing error codes, focus on how issues can be resolved rather than just their technical status. A tiered framework works well for this purpose, categorizing errors based on their required resolution approach:
- Transient Errors: These include issues like HTTP 503 (service unavailable) or HTTP 429 (too many requests). These errors are temporary and should automatically trigger retries using exponential backoff. This minimizes downtime without manual intervention.
- Persistent Issues: Errors like HTTP 400 (bad request) or invalid credentials indicate problems that won't resolve with retries. In these cases, retries should stop, and the system should notify support teams for further action.
- Business Process Issues: Some errors, such as duplicate entries, require manual intervention. These are not technical failures but rather workflow-related problems that need human oversight to resolve.
To streamline troubleshooting, always log structured metadata. Include details like request and response payloads, timestamps, and unique correlation IDs. This makes it easier to trace and diagnose issues quickly.
What’s the minimum safe data to log without exposing PII or tokens?
When logging, focus on non-sensitive metadata to track events effectively without compromising PII or credentials. Avoid including sensitive data like API keys, tokens, passwords, or payment information in your logs. Instead, structure your logs with useful details such as:
- Correlation/request IDs
- Resource names
- Error types
- Operation durations
Never log raw user input. If identifiers are necessary, ensure they are non-sensitive and anonymized. Always treat logs as untrusted data and implement strict access controls to prevent any unauthorized disclosure.
When should errors be retried vs sent to a dead-letter queue?
Use automated retries with exponential backoff to handle transient errors such as network timeouts, rate limits (429), and server-side issues (500, 502, 503, 504). This approach spaces out retry attempts progressively, helping to reduce strain on the system. Make sure your operations are idempotent to prevent duplicate actions during retries.
For persistent errors like invalid credentials, malformed payloads, schema mismatches, or 404 errors, route them to a dead-letter queue (DLQ) for manual inspection. This ensures you avoid wasting resources while keeping track of issues without losing data.
Related Blog Posts
Get new content delivered straight to your inbox

The Response
Updates on the Reform platform, insights on optimizing conversion rates, and tips to craft forms that convert.



Drive real results with form optimizations
Tested across hundreds of experiments, our strategies deliver a 215% lift in qualified leads for B2B and SaaS companies.
