
.webp)
Marketing Automation KPIs: How to Measure



I measure marketing automation by qualified leads, pipeline, and revenue - not clicks alone. Start with one business goal, one primary KPI, and a baseline. For example, moving form completion from 4% to 5% is a 25% relative increase - but I’d also check whether lead quality holds up.
Here’s the measurement plan I use:
- Define the numbers: Set formulas, targets, owners, costs, and conversion windows.
- Connect the data: Link forms, CRM, email, and analytics while keeping source data and consent intact.
- Check results: Compare groups with equal time to convert, and report sourced and influenced revenue separately.
- Test fixes: Check tracking first, then use a randomized control group to test the bottleneck.
My rule: <u>more activity isn’t proof of growth</u>. I look for better downstream results before scaling a workflow.
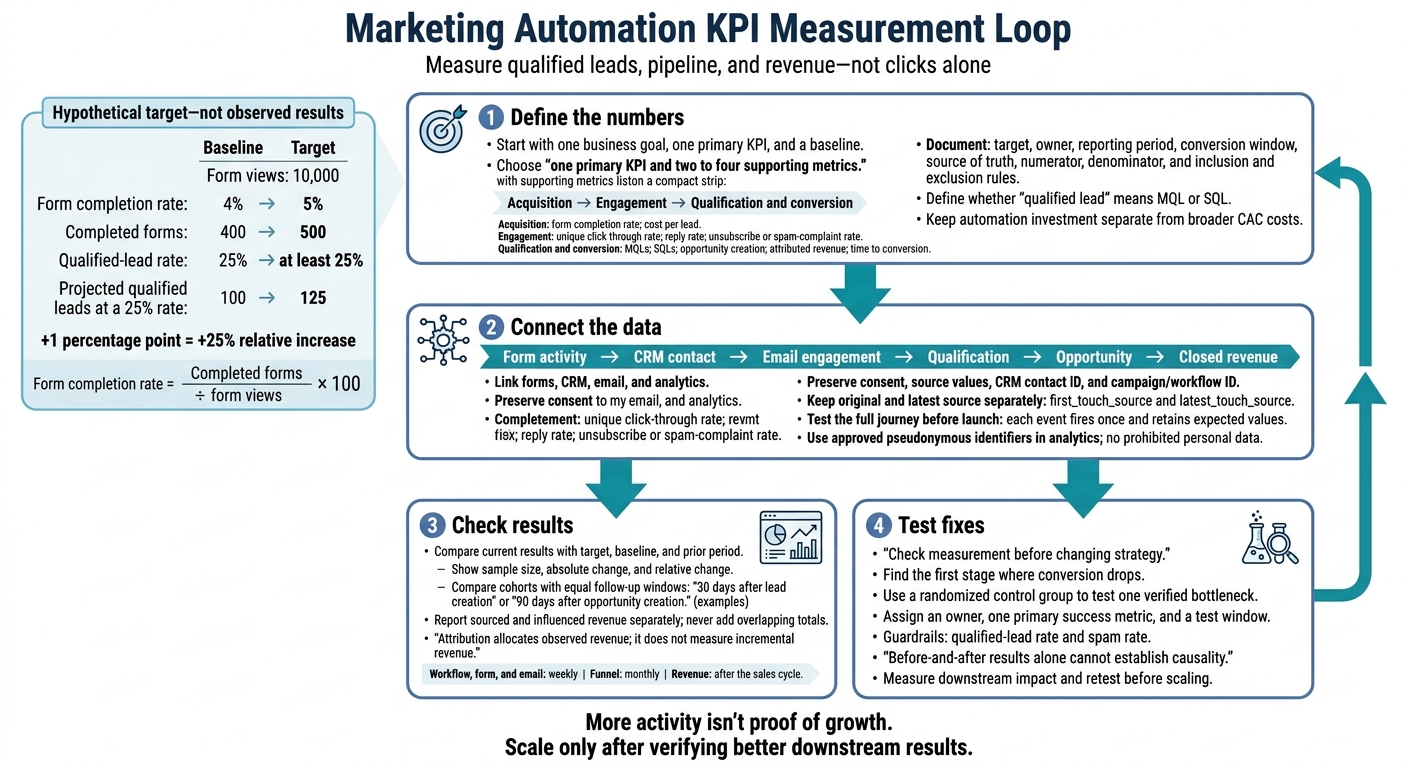
Marketing Automation KPI Measurement Loop
The Only Marketing KPIs You Should Actually Care About | Full Digital Data Course | VIDEO 13
sbb-itb-5f36581
Step 1: Set Goals, KPIs, and Baselines
Start with the result you want. Then choose the metrics that show whether you achieved it.
Write one sentence describing the business outcome for each workflow. Record its audience, conversion event, owner, and measurement window. Choose one primary KPI and two to four supporting metrics. If a workflow aims to generate qualified opportunities, judge it by opportunities created - not just the number of contacts entering it.
Choose KPIs by Funnel Stage
Match your metrics to the workflow’s funnel stage:
- Acquisition: Form views, form completion rate, new contacts, landing-page conversion rate, and cost per lead.
- Engagement: Email delivery rate, unique click-through rate, reply rate, stage advancement, and unsubscribe or spam-complaint rate.
- Qualification and conversion: MQLs, SQLs, opportunity creation, MQL-to-SQL rate, qualified-lead-to-customer rate, attributed revenue, and time to conversion.
Add CAC, ROI, or customer lifetime value when they support the goal. Use churn, renewal rate, or expansion revenue only if the workflow has a documented retention or customer-success goal.
Document KPI Formulas and Reporting Rules
Build a shared KPI dictionary so everyone uses the same calculations:
| KPI | Formula |
|---|---|
| Form completion rate | Completed forms ÷ form views × 100 |
| Email click-through rate | Distinct recipients who clicked ÷ delivered emails × 100 |
| Qualified-lead-to-customer rate | Customers from a qualified-lead cohort ÷ qualified leads in that cohort × 100 |
| CAC | Defined acquisition costs ÷ new customers acquired |
| Revenue-based return | (Attributed revenue − automation investment) ÷ automation investment × 100 |
For every KPI, document the target, owner, reporting period, conversion window, source of truth, numerator, denominator, and inclusion and exclusion rules. Specify whether “qualified lead” means MQL or SQL.
Apply the same exclusion rules for duplicate records, repeated submissions, internal traffic, test records, bot activity, bounced emails, and unsubscribed contacts.
Revenue-based return excludes margins and doesn’t prove incremental impact. Use profit-based ROI only when you can measure incremental gross profit.
Set Targets From Baseline Results
Base targets on comparable past campaigns or a pilot period - not a zero baseline. Save counts alongside rates, plus the date range, audience segment, source, device, geography, and workflow version. Keep qualification and attribution rules unchanged.
Match conversion windows to your sales cycle. If the median cycle is 45 days, a 60- or 90-day cohort window tells you more than judging customer conversion after seven days.
Hypothetical target: Increase demo-form completion from 4% to 5% while keeping the qualified-lead rate at or above 25%. At 10,000 form views, that means targeting 500 completions instead of 400 and 125 qualified leads instead of 100. These are projections, not observed results.
Document campaign costs, software expenses, and labor assumptions in U.S. dollars. Keep automation investment - platform fees, implementation, and workflow labor - separate from broader CAC costs. Those can also include advertising, content production, and sales labor. Before launch, have marketing operations, sales, finance, and the workflow owner approve these definitions.
Step 2: Connect Systems and Keep Source Data
Once you’ve defined your KPIs, build a tracking plan to supply the data. Document each event and field, including its format, allowed values, destination, integration method, owner, consent requirement, and validation test. Set overwrite rules and use consistent timestamps.
Map the journey from form activity through CRM contact, email engagement, qualification, opportunity, and closed revenue. Assign owners for taxonomy, form and tag setup, CRM stages, analytics governance, and consent rules.
Track Form Events and Map CRM Fields
Track form views, starts, successful completions, submission IDs, and timestamps. Add step tracking and abandonment signals where supported.
Map contact ID, lifecycle stage, consent, form name/version, source fields, submission validation status, and UTM values to dedicated CRM properties. Keep valid submissions separate from invalid records in the CRM sync. When the identity match is reliable, update the existing contact rather than creating a new one for every submission.
Reform supports multi-step forms, conditional routing, lead enrichment, spam prevention, email validation, real-time analytics, and CRM integrations. These features help you check form events and source data. Confirm which events, fields, and integration methods your connection supports, then check that consent and source values survive every handoff.
Connect Email Data and Test Analytics Events
Pass the CRM contact ID and a stable campaign or workflow ID between systems. Email addresses and campaign names alone aren’t enough.
Link sends, deliveries, bounces, clicks, replies, workflow entry, unsubscribes, and conversions to the correct contact and campaign/workflow ID. Clicks indicate engagement, not qualification. Use opens cautiously because privacy features can distort them.
Use lowercase event names with fixed parameters.
Example event names:
form_view,form_start,form_submit,cta_click,demo_request,opportunity_created, andpurchase.
Test the full journey in a staging environment. Submit the form, confirm the CRM record, trigger the workflow, click the CTA, create an opportunity, and verify revenue sync. Check that each event fires once, carries the expected values, reaches only approved destinations, and retains campaign parameters.
Do not send prohibited personal data - such as raw email addresses, names, phone numbers, or free-text responses - to analytics tools. Use approved pseudonymous identifiers instead.
Use this map to check each system before launch.
| System | Required data | Integration | Supported KPI | Validation check |
|---|---|---|---|---|
| Forms | Form name, submission ID, timestamp, step, completion status, consent, UTM fields | Native CRM connection, webhook, or API | View-to-start rate, completion rate, abandonment rate, valid submissions | Submit test records; confirm one event, correct timestamp, consent status, and source values |
| CRM | Contact ID, lifecycle stage, lead status, owner, qualification, opportunity, revenue | Form and email-platform sync | MQL rate, SQL rate, opportunity rate, pipeline, closed revenue | Confirm field types, allowed values, duplicate handling, and stage updates |
| Email automation | Contact ID, workflow ID, send, delivery, bounce, click, reply, unsubscribe, conversion | CRM and email-platform integration | Delivery rate, click rate, reply rate, workflow conversion, unsubscribe rate | Trigger test workflow entry; verify one entry, correct suppression, campaign association, and conversion sync |
| Analytics | Event name, event parameters, page or campaign context, consent state, pseudonymous ID | Tag manager, analytics SDK, server-side endpoint, or approved API | Form conversions, CTA clicks, source performance, assisted conversions | Inspect test-event payloads, confirm no prohibited personal data, and compare analytics counts with CRM counts |
Alongside each row, record the data owner, implementation date, last test date, and resolution status for failed checks.
With event tracking in place, preserve source data so you can assign credit correctly.
Preserve Lead Sources and Define Attribution
Standardize utm_source, utm_medium, utm_campaign, and utm_content. Standardize utm_term when paid search reporting requires it.
Use fixed values such as
paid_search,q4_demo_campaign, andcomparison_ad; avoid variations unless they are deliberately normalized.
Keep the first nonempty source as the original source. Update the latest source only under a documented rule. Record both first_touch_source and latest_touch_source for acquisition and re-engagement reporting.
Define attribution windows and state whether each window uses first touch, last touch, or each eligible interaction.
Example windows: 30 days for lead conversion and 90 days for opportunity influence.
Report sourced and influenced revenue separately. Never add overlapping totals. Attribution allocates observed revenue; it does not measure incremental revenue.
Audit missing UTMs, inconsistent campaign names, conversions with no source, broken redirects, mismatched campaign IDs, and differences between CRM revenue and analytics conversion totals.
| Model | Credit assignment | Question answered | Limitation |
|---|---|---|---|
| First-touch | Credits the first recorded marketing interaction | Which channel introduced the contact? | Undervalues later interactions |
| Last-touch | Credits the final recorded interaction before conversion | Which interaction preceded conversion? | Can over-credit bottom-of-funnel actions |
| Multi-touch | Splits credit across recorded interactions using a defined rule | Which interactions were associated with the journey? | Requires complete tracking and consistent rules |
Step 3: Review Results and KPI Trends
Once tracking and baselines are in place, review trends on a set schedule.
Monitor Workflow, Form, and Email Performance
Look for places where the funnel slows down, fails, or loses quality. For workflows, track enrollments, step-to-step conversion, completion rate, time between steps, errors, and delivery failures.
For forms, monitor form completion, abandonment, validation failures, spam submissions, and qualified-lead rate. For email, track delivery, bounces, clicks, conversions, unsubscribes, and spam complaints. Treat open rate as a directional signal, since privacy features and automation can distort it. Use clicks and conversions to assess intent.
Connect these metrics to lead-to-SQL rate, pipeline generated, time to conversion, revenue, customer acquisition cost (CAC), and return on investment (ROI). More activity isn't a win if lead quality drops.
Build Dashboards and Compare Mature Cohorts
Compare current performance with the baselines from Step 1. Build four dashboards:
- Executive: Business results.
- Funnel: Stage volumes and conversion rates.
- Workflow: Workflow health.
- Data quality: Missing source values, duplicate records, invalid emails, unmapped lifecycle stages, integration failures, and delayed CRM updates.
Show current results, target, baseline, prior period, sample size, and absolute and relative change. A rise from 4% to 5% is 1 percentage point or 25% relative growth - not 1%.
Review workflow, form, and email metrics weekly, funnel results monthly, and revenue after the sales cycle. Compare cohorts with equal follow-up windows: for example, 30 days after lead creation or 90 days after opportunity creation.
State date ranges and use the same reporting time zone. Segment by source, campaign, audience, device, form, workflow, and lifecycle stage only when sample sizes support comparison. Add notes for seasonal patterns, promotions, outages, budget shifts, and routing changes.
Find the Cause of KPI Changes and Test Fixes
When a KPI shifts, find the first stage where performance breaks.
Check measurement before changing strategy. Review analytics events, form submissions, email delivery logs, CRM synchronization, field mappings, attribution parameters, workflow enrollment rules, and dashboard filters.
Then compare each stage with its baseline and prior period to locate the first conversion drop. At that stage, check routing, deliverability, audience changes, and sales follow-up.
Hypothetical diagnostic example: Form completion increases, but SQL volume falls. Before expanding traffic, check spam filtering, qualification-field mapping, and source mix. Confirm that routing and CRM status updates still work, then compare qualified-lead and SQL rates by source, device, form version, and campaign. This pattern suggests where to investigate; it does not prove a cause.
Give each corrective test an owner, one primary success metric, a test window, and guardrails for qualified-lead rate and spam rate.
For example, test a shorter form against the existing form, with completion rate as the primary metric and qualified-lead rate and spam rate as guardrails.
Use a randomized control group. Before-and-after results alone cannot establish causality. Log the hypothesis, KPI definition, workflow and form versions, action taken, effective date, affected records, and result.
Conclusion: Make KPI Measurement a Repeatable Process
Measure pipeline, revenue, and acquisition cost - not just activity. Document each KPI’s formula, baseline, target, and reporting rule.
Before scaling a workflow, check that forms, CRM, email, and analytics stay connected without losing source or campaign data. Compare cohorts using the same follow-up window. Higher completion or click rates matter only if lead quality and revenue also improve.
Keep KPI measurement repeatable with this short loop:
- Validate one workflow from start to finish: Trace a test submission through source → form → CRM → email → analytics → revenue.
- Assign reporting owners: Give each KPI one owner, with support from marketing ops, sales ops, and finance.
- Schedule trend reviews: Check workflow issues weekly, funnel trends monthly, and attribution and targets quarterly.
- Fix the largest verified bottleneck first: Check the data, test one controlled fix, and measure its downstream impact. Retest before expanding the fix.
FAQs
How do I measure automation’s incremental revenue?
Compare closed-won revenue attributed to marketing automation with a counterfactual baseline - revenue you would have earned without automation - to measure lift in U.S. dollars.
Connect forms → CRM → email/analytics to trace revenue back to its source or campaign. Use that data to build a view of pipeline and revenue influence, including annual recurring revenue (ARR).
Check that conversion counts match actual business activity to validate attribution. Subtract automation-related costs from attributed closed-won revenue to calculate the net return in U.S. dollars. Measure lift against the baseline; express ROI as a percentage of costs.
How much data do I need before trusting KPI trends?
Before trusting KPI trends, check that your data is clean, complete, and valid. Run diagnostic checks and set specific confidence thresholds to judge how reliable it is. Marketing ROI often takes 6 to 12 months to fully materialize, so short-term fluctuations alone won’t tell the whole story.
Treat automation as a continuous loop: trigger, decision, action, and learning. Use real-time analytics to track performance, but keep the limits of live dashboards in mind.
How do I reconcile conflicting CRM and analytics numbers?
Choose a source of truth: use your CRM for firmographic and sales data, and analytics or email tools for behavioral data. Align UTM and source fields, then pass them from forms to your CRM once. Lock first-touch fields and update last-touch fields. Audit missing or duplicate UTMs and failed syncs.
Give both teams a shared dashboard with consistent attribution rules and common join keys, such as utm_id. That way, they report the same funnel stages and conversion counts.
Related Blog Posts
Get new content delivered straight to your inbox

The Response
Updates on the Reform platform, insights on optimizing conversion rates, and tips to craft forms that convert.


Drive real results with form optimizations
Tested across hundreds of experiments, our strategies deliver a 215% lift in qualified leads for B2B and SaaS companies.
