
.webp)
Ultimate Guide To AI Lead Scoring Optimization



Most lead scoring systems fail for one simple reason: they are never checked against closed revenue.
If I want AI lead scoring to help sales, I need to do four things well:
- Feed the model clean, enriched data
- Use fit, behavior, intent, and negative signals
- Set score thresholds from conversion results
- Review and retrain the model every 3–6 months
That’s the core idea.
A model with 1,000+ lead records and 120–200+ closed-won deals usually has enough history to learn from. If key fields are under 70% complete, scoring quality drops. And if high-scoring leads do not convert better or close faster, the model is pointing sales in the wrong direction.
Here’s the short version of what matters most:
- I should score lead quality and buying activity, not just form fills
- I should include bad-fit signals like competitor domains, unsubscribes, and personal email addresses
- I should route hot leads fast, because follow-up within one hour can far outperform a reply that comes a day later
- I should track precision, false positives, MQL-to-SQL rate, sales acceptance, and pipeline by score band
- I should add account-level scoring, score decay, and real-time updates once the basic model works
| Area | What to focus on | Good benchmark from the article |
|---|---|---|
| Data | Clean, labeled history | 4–6 weeks of data cleanup |
| Model choice | Match model to data volume | Rule-based for low data; AI for 1,000+ leads |
| Thresholds | Tie scores to actual conversion | MQL threshold often falls between 60–75 |
| Review cycle | Check for drift | Audit quarterly; retrain every 3–6 months |
| Advanced setup | Add account context | 5–10 stakeholders in many enterprise deals |
In short: AI lead scoring works when it is tied to revenue, checked against outcomes, and updated on a set schedule - not when it just assigns points and gets left alone.
The AI Lead-Scoring Model That Beats Your CRM's
sbb-itb-5f36581
Build the right data foundation
AI scoring only works when the training data is clean, complete, and tied to the right signals.
Collect fit, behavior, intent, and negative signals
Start with what the model will learn from. In most setups, that means four signal types.
Fit signals show whether a lead matches your ideal customer profile. Think job title, seniority, company size, industry, revenue, and tech stack.
Behavioral signals show when someone may be ready to act. A pricing page visit, demo request, or API documentation view says a lot more than one casual blog visit.
Intent signals come from third-party providers that track anonymous research activity across the web. They can flag accounts that are actively looking at tools in your category before anyone fills out a form.
Then there are negative signals. These matter just as much. Competitor domains, personal email addresses like Gmail or Yahoo, student or intern titles, and unsubscribes usually point to lower conversion odds. Taking points away for those signals helps keep the pipeline cleaner and makes the model easier for sales to trust.
| Data Source | Signal Type | Examples |
|---|---|---|
| CRM / Enrichment | Fit (Firmographic) | Industry, employee count, revenue, tech stack, geography |
| CRM / Enrichment | Fit (Demographic) | Job title, seniority, department, role function |
| Marketing Automation | Behavioral | Email clicks, webinar attendance, content downloads |
| Website Analytics | Behavioral | Pricing page visits, demo requests, feature page views |
| Product Analytics | Behavioral (PQL) | Feature activation, session depth, teammate invites |
| 3rd Party Providers | Intent | Anonymous research on competitor sites or industry topics |
| CRM / Support | Negative | Unsubscribes, bounces, competitor domains, student emails |
One more thing: score sequences, not just raw activity volume. A path like blog post, then case study, then pricing page is a much stronger signal than 50 blog visits.
Clean, label, and prepare historical lead data
After you define the signal types, clean up the historical records behind them. Raw CRM data is almost never ready for training.
Before training, plan for 4–6 weeks of data hygiene. That usually means deduplicating contacts, standardizing free-text fields like job titles and industries into set categories, and checking fields for completeness. If any field is below 70% completeness, enrich it before training. When firmographic data is incomplete, AI scoring accuracy can drop by as much as 27%.
Once the data is clean, label each historical lead clearly as converted or not converted. Use a 6- to 24-month lookback window. Also include closed-lost reasons, so the model learns what failure looks like too, not only what success looks like.
Most predictive models need at least:
- 1,000 lead records
- 200 closed-won deals
That’s the point where output starts to look dependable. Below that, the model can overfit to noise instead of learning real buying patterns.
Before launch, validate the model on a holdout set of historical wins and losses. If it misses on past data, it’ll miss in production too.
Improve form inputs before scoring starts
The scoring model can only work with what your forms send it. If your forms collect messy job titles, missing firmographic data, or personal email addresses, those issues go straight into training data and live scoring.
That’s why form quality is one of the highest-leverage fixes you can make upstream.
Use validated, multi-step forms with lead enrichment, email validation, and spam prevention to improve the data your model learns from. Reform supports these features in a no-code, conversion-focused builder with real-time analytics and CRM integrations.
Clean inputs make score bands and handoff thresholds more dependable. Once those inputs are in good shape, you can map them to score bands and routing rules.
Configure an AI scoring model that fits your funnel
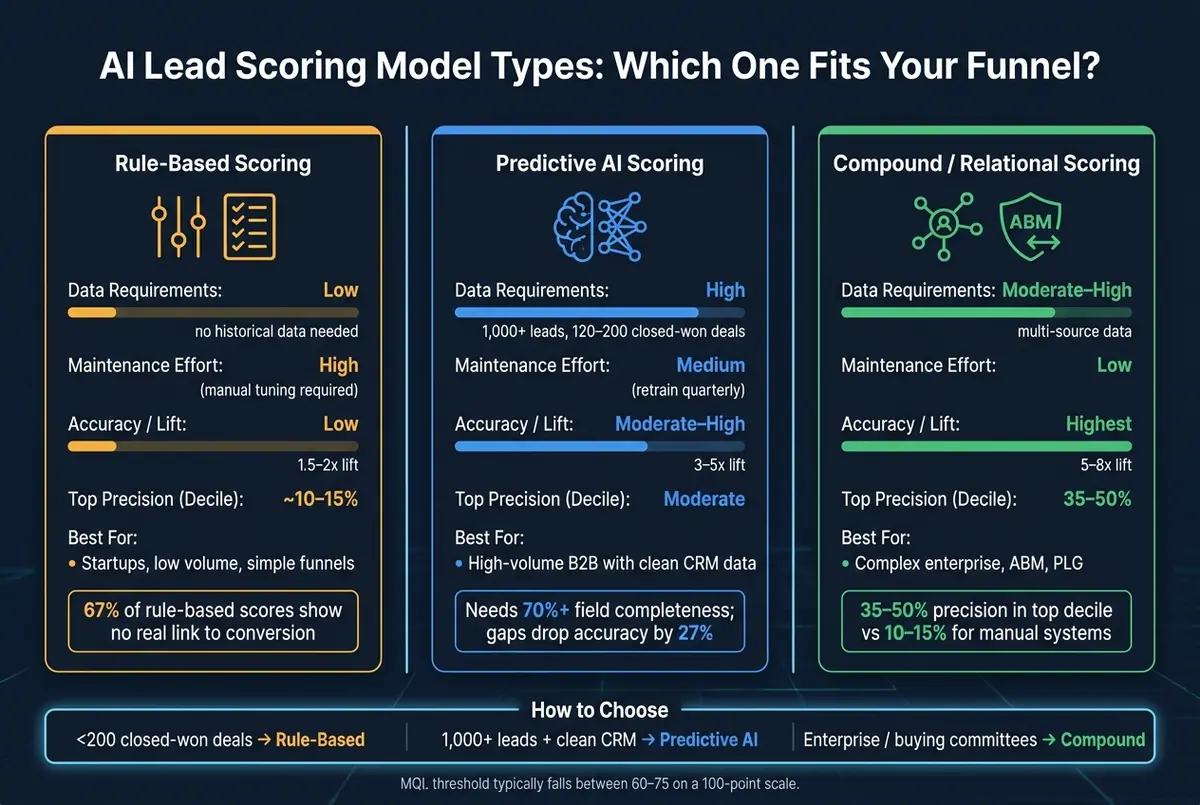
AI Lead Scoring Model Types: Rule-Based vs Predictive vs Compound
Choose rule-based, predictive, or compound scoring
Pick a model that fits your sales cycle and the data you actually have, not the setup you wish you had. If you have fewer than 200 closed-won deals, rule-based or hybrid scoring is usually a safer bet than predictive AI.
Rule-based scoring assigns manual point values to known signals. Think +10 for a VP title or +10 for a pricing page visit. It’s the safest option when historical conversion data is thin. Sales teams also tend to like it because it’s easy to read at a glance. The catch: someone has to keep tuning it by hand, and 67% of old-school rule-based scores show no real link to conversion.
Predictive AI scoring uses machine learning to find patterns across past leads. It tends to work best when you have at least 1,000 historical leads and about 120–200 closed-won deals, with clean data underneath it. It cuts down on manual upkeep, but you should still retrain the model every quarter.
Compound scoring combines fit and intent in one model. In plain English, it separates who a lead is from what they do. That makes it a strong match for complex enterprise funnels, especially when buying committees are involved. Relational ML models can hit 35–50% precision in the top decile, versus 10–15% for manual point systems.
Use the table below to line up the model with your funnel.
| Model Type | Data Requirements | Maintenance Effort | Accuracy Expectation | Best-Fit Use Case |
|---|---|---|---|---|
| Rule-Based | Low; no historical data needed | High | Low (1.5–2x lift) | Startups, low volume, simple funnels |
| Predictive AI | High; 1,000+ leads, 120–200 closed-won deals | Medium | Moderate–High (3–5x lift) | High-volume B2B with clean CRM data |
| Compound/Relational | Moderate–High; multi-source data | Low | Highest (5–8x lift) | Complex enterprise, ABM, PLG |
Set score bands and handoff thresholds
Once you’ve picked a model, define what each score range means in practice. A score by itself isn’t useful. The point is to turn that number into a clear next move for marketing, SDRs, and AEs.
A practical five-tier setup looks like this.
| Score Band | Lead Quality Tier | Typical Action |
|---|---|---|
| 81–100 | Hot | Direct AE routing; follow up within one hour |
| 61–80 | Warm | SDR qualification within 24 hours |
| 41–60 | Nurture | Automated nurture and targeted content |
| 21–40 | Low-touch | Light email nurture |
| 0–20 | Disqualified | Recycled or held back |
Set your MQL threshold using the last six months of conversion data. Look for the point where conversion rates start to climb faster. In many cases, that threshold lands between 60 and 75 on a 100-point scale. A healthy MQL-to-SQL acceptance rate usually falls between 60% and 90%. If sales is accepting more than 90% of what marketing sends, that’s often a sign the threshold is too low and should be pushed up.
There’s also a very human constraint here: SDR capacity. If your team can only work 40 SQLs a week, sending 90 won’t help anyone. Set the threshold so output matches what the team can handle.
Those score bands only matter if routing happens on its own.
Connect scores to routing and nurture workflows
A score sitting in a dashboard doesn’t do much. The payoff comes when that score kicks off the right next step inside your CRM or marketing automation platform.
Routing turns score quality into faster follow-up and cleaner handoffs. For hot leads (81–100), the workflow should happen right away: create a CRM task, send a Slack or Teams alert to the assigned rep, and start a fast-track sales sequence. When a high-scoring lead gets a response within one hour, conversion hits 53%. Wait more than 24 hours, and that drops to 17%.
Route based on both fit and intent. High-fit, high-intent leads should go straight to sales. High-fit, low-intent leads are better off in ABM nurture paths. That split keeps handoff logic tied not just to account quality, but to buying readiness too.
One small detail can make routing much more useful: add reason codes to the CRM record. Show reps the top drivers behind the score, such as "visited pricing page 3x." That gives sales instant context and makes outreach easier to tailor from the first touch.
Next, test whether those thresholds lead to better SQL rates and stronger pipeline results.
Measure performance and calibrate the model
Once routing is live, you need to check a simple thing: do the score bands line up with revenue?
If they don’t, the model may look good on paper while sending the wrong leads to sales.
Track model quality and funnel outcomes
Track both prediction quality and pipeline results. If you only watch one side, you miss part of the story.
On the model side, watch precision, recall, F1 score, and false positive rate. Precision shows how often a "hot" prediction is correct. Recall shows how many actual buyers the model catches. F1 score balances those two. A high false positive rate usually means the model is giving too much weight to weak signals.
On the business side, focus on optimizing lead conversions, sales acceptance rate, pipeline velocity, close rate by score band, and sales cycle length. Report these by score tier, not just as one rolled-up number. If your top score band doesn’t convert much better than the band below it, the model needs recalibration.
| Metric | What It Tells You | Warning Sign |
|---|---|---|
| Conversion Rate by Score Band | Validates the model's predictive power | High-score leads convert at similar rates to low-score leads |
| False Positive Rate | Checks whether the model is overweighting signals | Sales consistently rejects leads the AI marked "Hot" |
| Rep Override Rate | Measures sales trust in the model | Reps frequently ignore or manually change scores |
| MQL-to-SQL Time | Measures how quickly marketing-qualified leads are accepted | Increasing time for sales to accept high-scoring leads |
| Sales Cycle by Score | Confirms top leads close faster | Top-scoring leads take as long to close as average leads |
If top-tier leads aren’t converting faster, the score bands need recalibration.
Calibrate score ranges against real conversion data
Pull 6–12 months of closed-won and closed-lost outcomes and test whether your score bands predict results. A well-calibrated model should show a clear staircase pattern: each higher tier converts at a meaningfully higher rate than the one below it.
Use score bands to rank conversion rates, not to defend fixed thresholds. That historical data should also test whether your current MQL threshold - set earlier from six months of conversion data - is too low, too high, or in the right place. A calibrated model should show a clear lift at each higher band.
| Score Band | Observed Conversion Rate |
|---|---|
| 80–100 | 20–25% |
| 60–79 | 10–15% |
| 40–59 | 5–9% |
| 0–39 | <2% |
Check close speed too. High-scoring leads should not just convert more often. They should also close faster. If leads scoring 90+ take longer to close than leads scoring 60, the model is probably rewarding the wrong behaviors.
Retrain, test, and refine on a schedule
AI models drift. Buyer behavior changes. Market conditions shift. The signals that pointed to conversion six months ago may not work now. Audit quarterly and retrain every 3–6 months. In fast-changing markets, review monthly.
Before you roll out any threshold change, run a split test. Keep the current model on 80% of leads and test the updated model on 20%. Then compare SQL rates and pipeline outcomes before moving to a full rollout. It’s a safer way to check progress without putting revenue at risk.
Also, add a required CRM rejection reason field so reps log why they rejected a high-scoring lead, such as "No Budget" or "Wrong Timing." Those rejection reasons give you the human context behind score drift. Review them monthly with marketing ops and sales leadership. They often show patterns that conversion data alone won’t catch. Feed those findings into the next scoring update.
Advanced optimization strategies
As the model gets better, it helps to add account-level context. Once lead scores are dialed in, extend them from the individual lead to the full account.
Use account-based scoring and buying committee signals
In enterprise sales, scoring only the contact isn’t enough. You need to score the account too. The average enterprise deal involves 5–10 stakeholders across multiple departments. That’s why account-based scoring matters: it rolls up activity from individual contacts into one account score.
One of the strongest signals here is the colleague signal. When one person at a company converts, others at that same company often follow at 3–5x the baseline rate.
This changes how you should weight activity. A burst of action from one heavy user can look good on paper, but interest from several people at the same company usually means more. Three people from one company checking your pricing page says more than one person returning again and again.
To make that work, your data has to be clean. CRM account hierarchies need to be in good shape, and contacts need to map to the same account. That gets even harder when product users sign up with personal email addresses, so lead-to-account matching can’t be sloppy.
From there, recency controls help keep those account signals current.
Add score decay, progressive profiling, and real-time updates
Decay automatically lowers old engagement so your hot-lead list reflects what’s happening now, not what happened weeks ago. Old activity can skew prioritization and add to the same model drift discussed in the measurement section. A common setup is exponential decay with a 14–30 day half-life for behavioral signals:
score = raw_points * 0.5 ^ (days_since_activity / half_life)
Progressive profiling solves a different problem. Long forms scare people off. Short forms get more completions, but they don’t give you much data. Progressive profiling gives you both: ask for only the basics at first, then collect more detail as leads come back. That can improve form conversion while still giving the model better qualification data over time.
Then comes real-time updating. Modern scoring systems don’t wait for a nightly batch job. They re-score leads as new signals come in. That keeps routing tied to current behavior instead of yesterday’s snapshot.
These methods tend to work best when account context, recency, and data capture all move together.
Conclusion
Better lead prioritization comes from scoring accounts and buying committees, keeping signals current with decay, and collecting more data without adding friction.
| Advanced Method | Benefits | Risks | Operational Prerequisites |
|---|---|---|---|
| Account-Based Scoring | Aligns with B2B buying committees; prevents duplicate outreach | Requires complex lead-to-account matching logic | Clean CRM account hierarchy; multi-contact tracking |
| Score Decay | Keeps sales focused on active intent; removes stale leads | May prematurely disqualify slow-moving enterprise deals | Automated workflow or native CRM decay settings |
| Progressive Profiling | Increases form conversion by asking fewer questions over time | Can lead to fragmented data if not synced correctly | Marketing automation platform with smart fields |
| Hybrid Modeling | Combines transparency with ML precision | Higher maintenance than single-model systems | 1,000+ historical conversion records |
Every optimization should tie back to measurable outcomes: lead quality, pipeline efficiency, and revenue.
FAQs
How do I know if my data is good enough for AI lead scoring?
Your data is ready when your CRM is clean, checked, and has at least 500 closed-won opportunities with steady records. In this case, quality matters more than volume. Duplicates, missing fields, or messy lifecycle stages can make AI lead scoring unreliable.
Before deployment, audit your data and make sure deal outcomes are accurate, contact-to-account links are correct, and past win/loss data is dependable. Tracked website activity and email engagement can help too. If you have fewer than 200 closed-won deals, the results may be too noisy.
What should I do if high-scoring leads are not closing?
Your model may be off. In many teams, the issue isn’t the math. It’s the data going in.
Start by auditing your CRM for stale, missing, or messy fields. If the inputs are inconsistent, the score won’t mean much. Then check a second thing: does the model still line up with your current Ideal Customer Profile? A scoring model built for last year’s buyer can drift fast.
Next, retrain the model using recent closed-won and closed-lost deals. That gives you a score based on what’s happening now, not what used to work.
It also helps to pressure-test your lead definitions against sales capacity. If marketing is sending more “qualified” leads than sales can handle, the label stops meaning anything. The same goes if teams don’t use scores in day-to-day work. A lead score only matters when reps, SDRs, and marketers actually use it to decide who to follow up with, when to act, and where to spend time.
When should I use account-based scoring instead of contact scoring?
Use account-based scoring when you need to track interest across several people at the same company. It gives you a better read on buying intent than contact scoring, which looks at one person’s actions and fit.
It matters most when your sales cycle includes multiple stakeholders. In that case, your team can focus on account-level interest instead of treating each lead like a separate story.
Related Blog Posts
Get new content delivered straight to your inbox

The Response
Updates on the Reform platform, insights on optimizing conversion rates, and tips to craft forms that convert.



Drive real results with form optimizations
Tested across hundreds of experiments, our strategies deliver a 215% lift in qualified leads for B2B and SaaS companies.
