
.webp)
Advanced Lead Scoring with Behavioral Data Features


If I had to boil it down to one point, it’s this: lead scoring works better when I treat behavior by intent, timing, and order - not just by raw activity. In this article, I compare four models - rule-based, behavioral rule-based, predictive, and hybrid - using the factors that matter most: data inputs, signal strength, how the model changes over time, and how steady the measurement stays.
Here’s the short version:
- Rule-based is the easiest to launch, but it often misses recency, sequence, and speed of activity
- Behavioral rule-based adds journey context, so it scores high-intent actions better than plain point systems
- Predictive uses past outcomes and can read hundreds or thousands of behavior points, often reaching 85%–92% accuracy when data volume is high
- Hybrid blends clear rules with ML pattern finding, which often leads to 80%–85% accuracy and 80%–85% sales adoption
A few patterns stand out fast:
- A demo request or pricing-page visit usually means far more than a pile of blog views
- 10 visits in 3 days should not be treated like 20 visits over 3 months
- Score decay and negative scoring help stop old activity from pushing weak leads into MQL status
- Account-level activity matters a lot, especially when 3+ contacts from one account engage at the same time
How Do Predictive Lead Scoring Models Work? - Sales Saas Breakdown
sbb-itb-5f36581
Quick Comparison
| Model | Best For | Main Strength | Main Limit |
|---|---|---|---|
| Rule-Based | Small teams, simple funnels | Fast setup, easy for sales to read | Low accuracy, manual upkeep |
| Behavioral Rule-Based | Teams that want more journey context | Better weighting for high-intent actions | Still fixed, still manual |
| Predictive | Teams with large lead and win data sets | Strong pattern detection from behavior | Harder to explain, needs more data and support |
| Hybrid | Teams that want both clarity and better ranking | Clear rules plus ML pattern spotting | More setup than rule-based |
What this article covers
I focus on how behavioral features change scoring performance, including:
- High-intent actions like demo requests and pricing-page visits
- Recency, such as 14- to 30-day score half-lives
- Sequence, like blog → case study → API docs → pricing
- Velocity, such as repeat sessions in 48 hours
- Negative signals, like unsubscribes, career-page visits, or bounced signups
In short, this piece shows when each scoring model fits best and how behavioral data changes the result. If I want scores that help sales act on the right leads, I need more than point totals - I need behavior put in context.
1. Rule-Based Lead Scoring
Rule-based lead scoring gives fixed point values to actions and attributes based on how closely they seem tied to buying intent. For example, a demo request might get +40 points, a pricing page visit +15 to +20, and a blog post view just +2. Once a lead crosses a set score threshold, the team marks it as an MQL.
Data Inputs
This setup works best when the signals are direct and high intent, like pricing page visits, demo requests, and high-value content downloads such as ROI calculators or buyer guides. It starts to wobble when the inputs are weak.
Email opens are a good example. Someone may open an email because the subject line caught their eye, not because they plan to buy. The same goes for heavy blog activity. A lead with 50+ blog views might look hot on paper, but that person could just as easily be a student, analyst, or researcher.
Intent Signal Strength
The main issue is that rule-based scoring looks at actions one by one. It doesn't read sequence or velocity, which is where a lot of intent shows up.
A lead who goes from a blog post to API docs to a pricing page is moving in a clear direction. That's a stronger signal than three random pageviews. But once those actions get boiled down into a point total, most of that meaning disappears. Timing matters too. 20 visits over three months and 10 visits in three days do not say the same thing, yet a static scoring model can treat them almost the same.
Adaptability and Measurement Reliability
Rule-based scoring also needs manual upkeep. When buyer behavior changes, someone has to dig into the data, change the weights, and test the new setup. That usually takes weeks. If nobody stays on top of it, the model drifts, and prediction accuracy tends to land around 40–55%.
Another headache is score inflation. If there is no time-decay logic, old activity keeps boosting the score. A lead who showed brief interest nine months ago can still pile up enough points to come back as an MQL long after that intent is gone.
"Without negative scoring, score inflation is inevitable: a lead who engaged briefly nine months ago will accumulate points over time and surface as an MQL long after any genuine intent window has closed." - Siddharth Gangal, Founder, Fairview
A better setup uses decay and negative scoring. That means applying a recency-based decay multiplier and subtracting points for disqualifying signals like email unsubscribes, bounced trial signups, or visits to a careers page. Those changes help cut drift, but the model is still built on fixed rules. That's where behavioral rule-based scoring starts to add more context to the numbers.
2. Behavioral Rule-Based Lead Scoring
Behavioral rule-based scoring starts with the same point system as standard rule-based scoring. The difference is where those points come from. It gives more weight to actions based on where they fall in the buying journey.
That matters because not all activity means the same thing. A blog visit and a pricing page visit shouldn't carry equal weight. One may show early interest. The other often points to someone who is much closer to a decision. So this model adds context while still sticking with fixed rules.
Data Inputs
The main idea is simple: score actions based on journey stage.
Late-stage actions usually carry more weight, such as:
- Repeat pricing page visits
- Demo requests
- Late-stage content downloads using optimized form templates
Repeat activity in a short time frame matters too. For example, a second pricing page visit within 14 days can earn extra points because it shows steady interest, not just a one-off browse.
Negative signals also matter. They help weed out leads that look active on the surface but aren't likely to buy. Common examples include visiting a careers page, unsubscribing from emails, or signing up with a personal email domain.
There's another wrinkle here: account-level activity. If several contacts from the same account engage around the same time, the chance of conversion can jump by 3–5x. Fixed rules often miss that pattern, which makes this model less useful in those cases.
Intent Signal Strength
The big takeaway is that intent matters more than volume.
A demo request means more than a pile of low-intent actions. A pricing page visit says more than broad content consumption. And the order of actions matters too. Someone moving from education to evaluation is showing a clearer path than someone who reads 40 blog posts with no sign of buying intent.
"A pricing page visit last week is a different signal than a pricing page visit six months ago. The key is recency and frequency, not raw count." - Kumo.ai
Adaptability and Measurement Reliability
This method still has blind spots. It can miss patterns like time-of-day behavior and account-level engagement. That's usually where predictive scoring starts to do a better job.
3. Predictive Lead Scoring
Predictive scoring uses past conversion data to learn how to qualify leads effectively to drive sales. For that to work well, you need enough volume to train the model with some confidence - usually at least 1,000 lead records and 200 closed-won deals. The big upside is simple: it turns raw behavior into richer signals like recency, sequence, and velocity.
Data Inputs
Predictive models work from behavior at scale, not just a short list of hand-picked fields. A rule-based setup might rely on 15–30 manually chosen inputs. Predictive models can look at hundreds or thousands of data points at once, including scroll depth, hovers, click speed, and cross-session behavior.
They also read patterns across time, not just one-off actions. That means the model can tell the difference between a "researcher" who racks up lots of page views with low buying intent and a "buyer" moving from blog → case study → API docs → pricing. That path tells you far more than raw page count ever could.
Intent Signal Strength
Timing matters here, and predictive models treat timing as part of the pattern. Five page views in 10 minutes can mean something very different from five page views spread across two weeks.
They also give more weight to actions that show stronger purchase intent. In most cases, high-intent actions like demo requests are weighted 4x to 8x higher than lower-intent activity like email opens.
Adaptability and Measurement Reliability
Rule-based models need manual changes when buyer behavior shifts. Predictive models retrain on new outcomes instead. In many cases, they reach 85%–92% conversion accuracy with 5%–12% false positives, compared with 40%–55% accuracy and 30%–45% false positives for rule-based systems. Of course, this only works if the model has enough data. Without that, noise can drown out the signal. Implementing a proven lead conversions playbook can help stabilize these results.
"Traditional scoring treats leads as a collection of static attributes and isolated actions. AI scoring treats leads as dynamic entities whose behavior patterns reveal their true intentions." - Mosharof Sabu, Neuwark
That gives predictive scoring an edge at scale. The tradeoff is that it can be tougher to explain and manage without a clear system in place - which is where hybrid models come in.
4. Hybrid Lead Scoring
Hybrid scoring fixes the main weak spot in predictive scoring: sales can still understand why a lead scored well, while the model keeps adjusting rankings as behavior shifts.
Here’s the basic idea. A hybrid model combines a rule-based base layer with a predictive ML layer. The rule layer handles fit, behavior, and intent thresholds that sales teams can read and trust. Then the ML layer spots patterns those rules don’t catch, especially among the highest-scoring leads.
Data Inputs
Hybrid models pull from four signal types:
- fit
- behavioral
- intent
- negative signals
Behavioral signals usually get the most weight. Fit and third-party intent signals come next. Negative signals are mainly used for decay and disqualifiers. In strong hybrid models, behavioral signals usually account for 35–45% of the score, fit and intent each contribute 20–30%, and negative signals make up 10–15%.
Intent Signal Strength
Velocity matters more than raw volume. Three sessions in 48 hours beat 15 sessions over six months.
Some actions also carry much more weight than others. A visit to a high-intent page like pricing or a demo request can be worth +25 points, while a blog visit may top out at +5. That makes sense: not all traffic means the same thing.
There’s also an account-level pattern worth watching. When 3 or more contacts from the same account engage at the same time, conversion likelihood jumps 3x to 5x over baseline.
Adaptability and Measurement Reliability
The split between rules and ML is what makes hybrid scoring work so well in practice. The rule layer keeps the model explainable. The ML layer keeps rankings current as buyer behavior changes.
That explainability has a direct effect on adoption. Hybrid models see 80–85% sales adoption, compared with 60–70% for pure predictive models. Accuracy usually falls in the 80–85% range, and teams can often launch a hybrid model in 6–10 weeks. A fully predictive build, by contrast, may take 8–12 months.
Before changing lead routing, run the model in shadow mode for 14 days to check whether behavioral thresholds hold up. After launch, review the last 90 days of MQL-to-SQL data each quarter to spot drift and reset thresholds.
Those feature choices drive the performance differences below.
How Behavioral Data Features Affect Scoring Performance
Behavioral signals lead to better scoring when a model treats intent, recency, and sequence as separate things. This section looks at the same inputs covered earlier, but from the feature side instead of the model side.
Some actions show much stronger buying intent than others. Demo requests and pricing-page visits sit at the top of the stack. Blog reads sit at the bottom.
Timing matters just as much as the action itself. Many strong models use exponential decay, often cutting behavioral scores in half after 14 to 30 days of inactivity. And not all actions fade at the same pace. A pricing-page visit may lose weight fast, while a blog read can stay useful a bit longer.
Then there’s sequence. That part gets overlooked all the time. A path like blog → case study → API docs can point to someone moving toward a buying decision. On the other hand, a lead who reads 50 blog posts but never touches the pricing page is probably still in research mode.
The table below compares common behavioral features by intent strength, recency sensitivity, and setup difficulty. That mix helps explain why some scoring models are easy to read while others can react better to changing behavior.
| Feature Category | Buying-Intent Strength | Recency Sensitivity | Implementation Difficulty |
|---|---|---|---|
| Demo/Trial Request | Very High (+40–50 pts) | High | Low |
| Pricing Page Visit | High (+25 pts) | Very High (14-day half-life) | Low |
| Repeat High-Intent Sessions | High (+30 pts) | High | Medium |
| Product Usage Milestones | High | Medium | High (requires integration) |
| Enriched Form Submission | Medium-High | Low | Medium |
| Case Study/ROI Content | Medium (+10–15 pts) | Medium | Low |
| Blog/Top-of-Funnel | Low (+2 pts) | Low | Low |
In Reform, enriched form submissions add fit context, not just intent data. They’re less time-sensitive than a pricing-page visit, but the enrichment data still helps by adding fit signals next to behavior signals.
These feature differences drive the trade-offs below.
Pros and Cons of Each Scoring Model
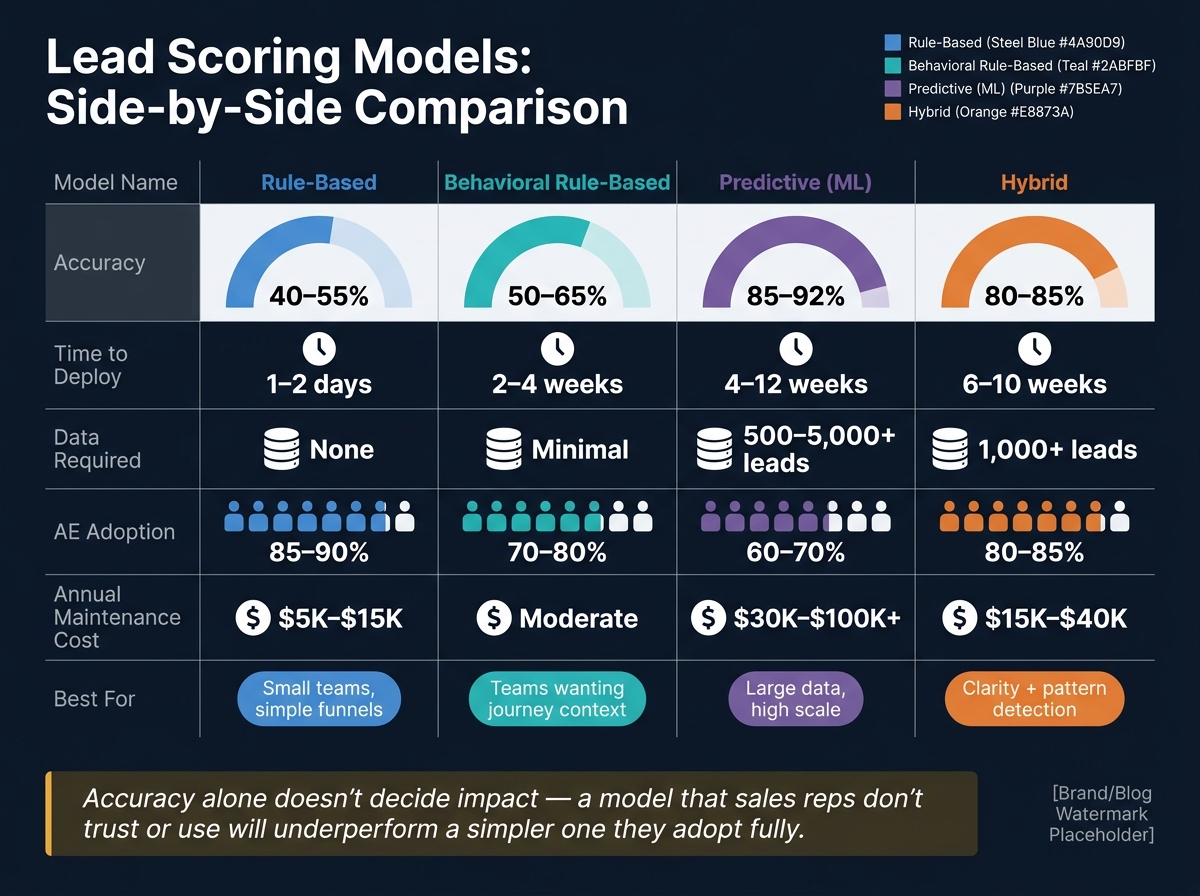
Lead Scoring Models Compared: Accuracy, Cost & Adoption
Every scoring model comes with trade-offs. The best fit depends on your data, your team, and how your sales process works.
At a high level, these models differ in how they handle behavioral signals, recency, and sequence. Some are simple and easy to trust. Others spot deeper patterns but take more time, more data, and more upkeep.
Rule-based scoring is the fastest to launch and the easiest to explain to sales teams. That simplicity is a big plus. The downside is accuracy: it tends to be the weakest option, and it can drift over time if no one recalibrates it.
Behavioral rule-based scoring gives you better signal quality because it factors in actions and engagement. But it still depends on manual tuning, and it usually misses patterns that only show up when several signals interact.
Predictive scoring is the strongest at finding patterns. That’s the upside. The catch is complexity. Teams usually need 500 to 5,000+ historical leads, a 4- to 12-week setup window, and MLOps support that can cost $30,000 to $100,000+ per year. It can also be harder for reps to trust because the logic isn’t always easy to see, which is one reason sales adoption often lands around 60% to 70%.
Hybrid scoring sits in the middle in a good way. It combines a clear rule-based base layer with an ML layer that spots patterns people might miss. That gives teams a model they can understand without giving up pattern detection. In practice, hybrid scoring tends to land at 80% to 85% accuracy, with 80% to 85% AE adoption, and a setup time of about 6 to 10 weeks. It also needs at least 1,000 historical leads.
| Model | Accuracy | Time to Deploy | Data Needed | AE Adoption | Annual Maintenance |
|---|---|---|---|---|---|
| Rule-Based | 40%–55% | 1–2 days | None | 85%–90% | $5,000–$15,000 |
| Behavioral Rule-Based | 50%–65% | 2–4 weeks | Minimal | 70%–80% | Moderate |
| Predictive (ML) | 85%–92% | 4–12 weeks | 500–5,000+ leads | 60%–70% | $30,000–$100,000+ |
| Hybrid | 80%–85% | 6–10 weeks | 1,000+ leads | 80%–85% | $15,000–$40,000 |
One thing stands out fast: accuracy alone doesn’t decide impact. A model can score well in testing and still fall flat if AEs don’t use it. That’s why adoption matters just as much as raw performance.
The next section looks at how behavioral features shift these trade-offs.
Conclusion
The right scoring model comes down to where your sales team is right now.
Rule-based scoring works well for simpler sales motions. Hybrid scoring makes sense for teams that want clear rules but also need more scale. Predictive scoring fits organizations with lots of data to work with. The right pick depends on two things: the quality of your behavioral data and how clearly those signals point to buying intent.
Behavioral signals lose value fast. What someone did last week can matter a lot more than what they did last quarter. That’s why recency controls and negative signals matter so much.
No matter which model you use, a few practices help keep scores useful instead of noisy:
- Use score decay so older actions count less over time
- Apply negative scoring when behavior shows lower intent
- Recalibrate on a regular basis so the model still lines up with how people buy
The best model is the one that turns behavioral signals into clear sales action without adding noise.
FAQs
Which lead scoring model should I start with?
Start with a rules-based model if your company is early-stage, has low lead volume, and simple buyer personas. It gives marketing and sales a clear way to assign points based on firmographic and behavioral signals.
If you generate more than 500 leads per month and deal with complex buyer journeys, predictive or AI-based models tend to work better. Either way, look back at your last 200 to 500 closed-won deals and add decay for older behavioral signals.
How much historical data do I need for predictive scoring?
For a reliable predictive lead scoring model, you’ll usually want at least 200 converted leads and 6 to 12 months of historical data. Some teams look at as much as 24 months to account for longer sales cycles and more than one touchpoint.
That said, volume alone isn’t enough. The data also needs to be clean and complete. If key fields are missing or the inputs are biased, the scores can fall apart fast, no matter how advanced the model looks.
How often should I update or recalibrate lead scores?
Review your lead scoring model at least quarterly. Then compare it with actual sales results to make sure high-scoring leads are closing more often than low-scoring ones.
This matters because business conditions change. A static model can lose accuracy fast, and some drop by 30%–40% within six months. Use each quarterly review to factor in what you’ve learned from sales-rejected leads and keep scoring tied to current conversion data.
Related Blog Posts
Get new content delivered straight to your inbox

The Response
Updates on the Reform platform, insights on optimizing conversion rates, and tips to craft forms that convert.


Drive real results with form optimizations
Tested across hundreds of experiments, our strategies deliver a 215% lift in qualified leads for B2B and SaaS companies.
