
.webp)
Dynamic Segmentation Study: Email Form Results



Dynamic segmentation may improve email results, but it hasn’t proved better replies or higher revenue. My takeaway: test it against static forms, and track qualified meetings and paid conversions - not just opens and clicks.
One case study reported 7.8% conversions versus 3.4% for non-segmented campaigns. But its methods and conversion definition remain unverified, and it reported no reply-quality results.
Here’s what I’d measure in your form-to-follow-up workflow:
- Lead quality: Do form answers produce more sales-accepted leads?
- Routing speed: Measure assignment time separately from first human contact.
- Reply quality: Separate interested replies from automated responses and unsubscribe requests.
- Conversion: Compare meetings, opportunities, and paid customers using the same rules and follow-up window.
<u>More engagement isn’t proof of more sales.</u> I’d use a randomized test, keep other changes limited, and treat the published results as directional - not a promise.
Why Bigger Email Lists Lose
sbb-itb-5f36581
Study Results: Email Replies and Conversion
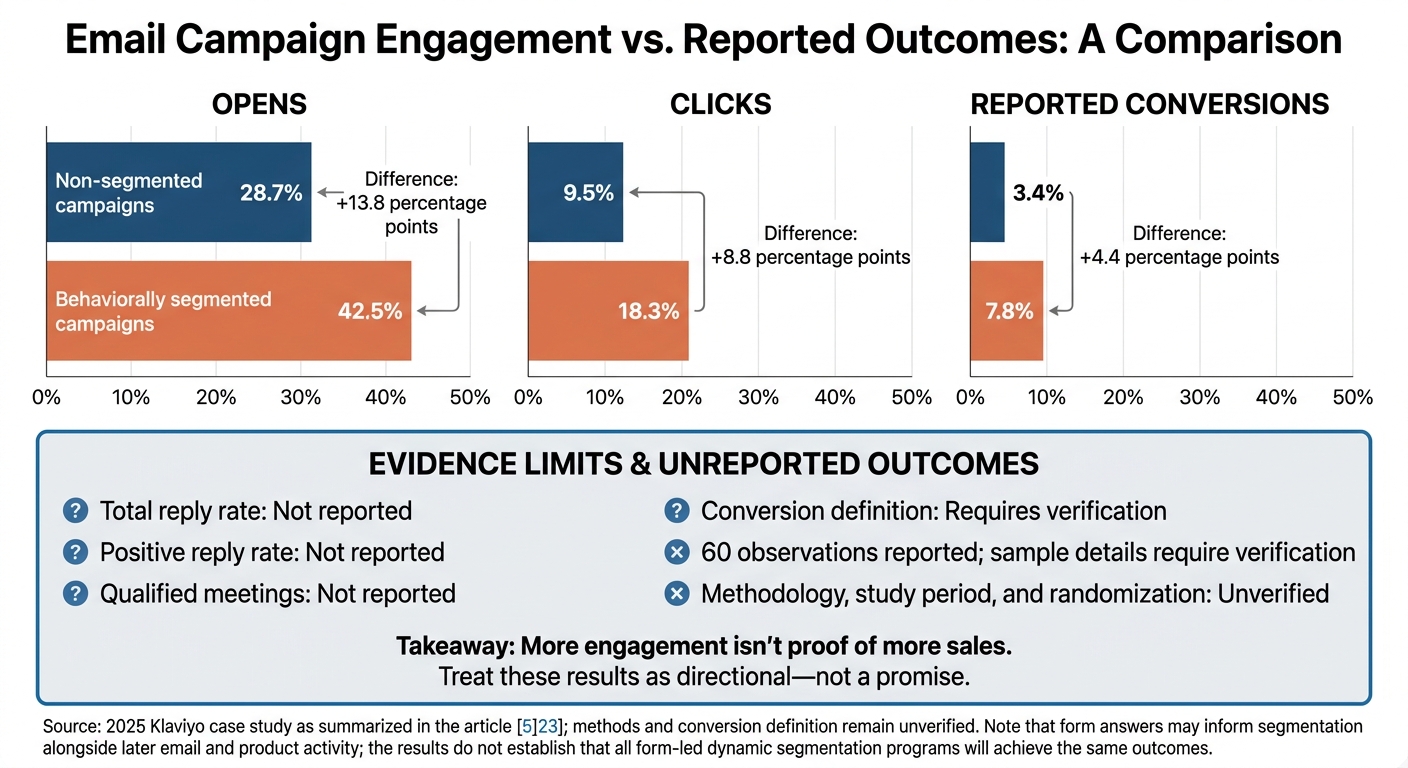
Email Segmentation Results: Engagement vs. Evidence
Results From Behavior and Intent Data
Higher engagement matters, but does it lead to more replies and conversions? A 2025 Klaviyo case study reported 42.5% opens, 18.3% clicks, and 7.8% conversions for behaviorally segmented campaigns. Non-segmented campaigns recorded 28.7%, 9.5%, and 3.4%, respectively.
The summary reports 60 observations. However, the methodology, sample, study period, randomization, and conversion definition remain unverified. Treat these results as directional only.
These findings apply to form-led workflows when form answers help set segment rules alongside later email and product activity. Using a multi-step form can help capture this data without increasing friction. They don't show that every dynamic segmentation program will deliver the same lift.
Total Replies vs. Qualified Conversations
The study did not report total replies, positive replies, or qualified meetings. That gap makes reply quality more important than reply volume. More replies could mean more objections, unsubscribe requests, or low-intent responses - not more sales opportunities.
Compare total reply rate, positive reply rate, qualified conversation rate, and qualified meeting rate. Use the same qualification rules for both groups.
For SaaS funnels, spell out what counts as a paid conversion instead of relying on an undefined conversion label. Report counts alongside rates. Also, pair positive replies per delivered email with qualified meetings per eligible form submission. This helps keep engagement quality separate from pipeline quality.
The table below separates reported study outcomes from details that still need verification.
| Source | Segmentation variables | Control condition | Segmented condition | Total reply rate | Positive reply rate | Qualified meetings | Reported conversion rate | Sample description | Study period |
|---|---|---|---|---|---|---|---|---|---|
| Behavioral case study using Klaviyo | Behavioral segmentation; exact events require verification | Non-segmented campaigns | Behaviorally segmented campaigns | Not reported | Not reported | Not reported | 7.8% vs. 3.4%; conversion definition requires verification | 60 observations reported; sample details require verification | Not reported |
Study Results: Lead Quality and Routing Speed
Form Fields for Qualification and Routing
If segmentation improved replies, test whether form data also improves routing and lead quality. Use form answers to update segments and route each lead in the same workflow.
Choose who follows up based on fit, intent, and territory: company size and industry for fit, product interest and buying stage for urgency, and region for territory. A named-account rule should override a general territory rule so the existing account owner stays assigned. The goal goes beyond faster handoffs: better MQL, SQL, and meeting rates after submission.
Collect only fields that affect routing or qualification. Use controlled choices, email validation, and enrichment where needed, and record whether each value came from the prospect or enrichment. To test the cost of extra questions, measure submitted leads, qualified leads, meetings, and conversion per visitor - not just form completion or qualification rates among submitted leads.
Send missing or conflicting data to a monitored fallback queue. If verified information changes a lead’s segment, follow a defined reassignment rule. Keep a record of both owners, timestamps, the reason for reassignment, and prior contact attempts.
Assignment Time vs. First-Contact Time
Assignment time and first-contact time are different measures. Track them separately, and distinguish human contact from automated contact. Routing reduces assignment time, alerts help teams follow up sooner, and instant scheduling removes the wait for outreach.
The studies below benchmark response speed, not dynamic segmentation. Treat them as evidence about timing - not proof that segmentation works.
| Source | Routing trigger | Assignment time | First-contact time | SLA target | Qualification outcome | Meeting-booked rate | Defined conversion rate |
|---|---|---|---|---|---|---|---|
| MIT/InsideSales Lead Response Management Study, 2007 | Web-form arrival; response timing | Not reported | Within 5 minutes versus 10 and 30 minutes | Not reported | Qualification odds were 21× higher at 5 minutes than at 30 minutes and declined approximately 4× from 5 to 10 minutes. | Not reported | Not reported; the study did not measure close rate or revenue conversion |
| Harvard Business Review, “The Short Life of Online Sales Leads,” 2011 | Online inquiry; response timing | Not reported | Within 1 hour versus waiting at least another hour | Not reported | Companies responding within 1 hour were nearly 7× more likely to qualify the lead than companies waiting at least another hour. | Not reported | Qualified conversation |
Use these timing benchmarks to test whether dynamic segments improve the same stages in your own workflow.
These findings show association, not causation. Lead intent, staffing, and business hours can affect both response speed and outcomes. Report median assignment and first-contact times, 90th-percentile delays, and separate SLA attainment for business hours, after-hours, and weekends.
Compare qualification, meetings, opportunities, and conversions across five timing bands: under 5 minutes, 5–30 minutes, 30–60 minutes, 1–24 hours, and over 24 hours. Track self-booked meetings separately from those booked after sales outreach.
Study Design and Research Limits
The reported lifts suggest a direction, not proof of cause. Test segmentation separately from the rest of the workflow, and measure its effects on form submissions, routing, replies, and conversion.
Comparing Static and Dynamic Test Groups
Use a concurrent randomized holdout test for form-led email workflows. Define eligibility before launch, assign visitors or accounts at their first eligible visit, and keep assignments stable across sessions. Keep traffic sources, offers, timing, and follow-up quality the same across groups. Before launch, set the primary outcome, sample-size target, and stopping rule.
| Dimension | Static control | Dynamic-segmentation treatment |
|---|---|---|
| Eligibility and observation window | Same eligibility and observation window | Same eligibility and observation window |
| Form fields | Fixed field set and order | Predeclared segment-based fields, prompts, or steps |
| Segment updates | No real-time reassignment | Treatment updates only on approved signals |
| Email messaging | Standard offer and sequence | Segment-specific copy or sequence with matched offer value and timing |
| Lead routing | Standard queue or territory assignment | Rule-based assignment using segment, fit, intent, territory, or capacity |
| Incremental lift versus concurrent control | Qualified and downstream conversion rates | Incremental lift versus concurrent control |
| Crossover policy | Treatment features unavailable | Crossover blocked or analyzed separately |
If you change the form, offer, messaging, and routing at once, you're testing the whole workflow - not segmentation alone. Keep the difference between groups narrow, use persistent identifiers to prevent crossover, and log exceptions. Analyze contacts by their original assignment, called intention-to-treat, even if they receive the wrong workflow.
Give each funnel stage its own denominator:
- Visitor-to-form: eligible visitors
- Form-to-MQL: completed forms
- MQL-to-SQL: MQLs
- SQL-to-opportunity: SQLs
- Trial-to-paid: trials
Report absolute counts, unique visitors or accounts, rates, deduplication rules, percentage-point changes, and confidence intervals or statistical test results. Use the original cohort for delayed outcomes, and label incomplete pipeline results as preliminary.
Source Quality and Other Causes of Change
Randomized tests offer the strongest evidence of cause and effect. Observational studies and vendor case studies can still help, but treat their gains as directional when controls, raw counts, or independent verification are missing. Attribution alone does not establish causation.
For sources reporting SaaS and B2B funnel outcomes, record the publication date, measurement period, sample size, audience, industry, geography, campaign type, form intent, segmentation inputs, comparison group, attribution model, observation window, funnel definitions, denominator, and verification status. These details help separate measured lift from changes in deliverability, staffing, and seasonality.
Compare rates only when populations, campaign types, stage definitions, attribution windows, denominators, and measurement periods are comparable. Flag historical controls, missing data, deliverability changes, seasonality, unequal intent, revised offers, and changes in sales follow-up. Log those changes, then check whether the results hold when affected periods or sources are excluded. More opens, clicks, or replies don't prove revenue gains without downstream conversion data.
Conclusion: Apply the Findings and Measure Results
Given these limits, use dynamic segmentation to measure how the workflow performs - not to assume attribution. Treat dynamic segmentation as a funnel-quality test, not proof of higher revenue. Test form quality, routing speed, reply quality, and conversion rather than submission volume alone. Extra questions can lower completion rates, while inaccurate enrichment or rigid rules can put promising leads in the wrong segment.
Build a Measurable Form-to-Follow-Up Workflow
Measure the full path from form submission to follow-up.
Keep only fields that affect a decision: company size, role, use case, timeline, current solution, budget, product interest, and communication preferences. Use conditional questions, validate emails, and filter out spam and duplicates. Enrich records only with reliable, legally appropriate data, and use segment rules that can be audited. Match follow-up to intent, and track assignment time separately from first human contact.
Save answers, consent, source, campaign, timestamps, segment assignment, rule versions, enrichment status, owner, and downstream conversions. Reform supports this workflow with no-code multi-step forms, conditional routing, enrichment, email validation, analytics, and integrations.
Compare Baseline and Dynamic Segmentation Results
Use the table below to compare baseline and dynamic segmentation results only when the data is verified and comparable. Set success criteria before testing. Remove or report separately any spam, duplicates, internal submissions, test records, and leads that haven't had enough follow-up time. Give revenue outcomes time to mature, and review results by segment and source.
| Metric | Baseline | Dynamic result | Absolute change | Relative change | Sample size | Observation window |
|---|---|---|---|---|---|---|
| Form completion rate | Not measured | Not measured | Not measured | Not measured | Not measured | Not measured |
| Valid-email rate | Not measured | Not measured | Not measured | Not measured | Not measured | Not measured |
| MQL rate | Not measured | Not measured | Not measured | Not measured | Not measured | Not measured |
| Sales-acceptance rate | Not measured | Not measured | Not measured | Not measured | Not measured | Not measured |
| Median assignment time | Not measured | Not measured | Not measured | Not measured | Not measured | Not measured |
| Median first-human-contact time | Not measured | Not measured | Not measured | Not measured | Not measured | Not measured |
| Positive-reply rate | Not measured | Not measured | Not measured | Not measured | Not measured | Not measured |
| Qualified-meeting rate | Not measured | Not measured | Not measured | Not measured | Not measured | Not measured |
| Opportunity rate | Not measured | Not measured | Not measured | Not measured | Not measured | Not measured |
| Trial-to-paid or closed-won conversion | Not measured | Not measured | Not measured | Not measured | Not measured | Not measured |
Report rate differences in percentage points, proportional changes as relative percentages, and time differences in minutes or hours. For assignment and first-human-contact times, use medians and useful percentiles.
Validity and sales acceptance show quality. Shorter contact times show speed, positive replies show interest, and downstream conversion shows revenue impact. If completion increases but valid-email rate, sales acceptance, or revenue conversion falls, the workflow hasn't improved the funnel. If replies increase without more qualified meetings or opportunities, revisit messaging and qualification rules. Keep monitoring segment drift and rule performance after launch.
FAQs
How much data do I need to test dynamic segmentation?
Put quality before volume. Clean and sync your CRM, web tracking, and form data. Before launch, manually check every branch’s routing, field mapping, and owner assignment.
Track step completion, route splits, and lead quality by source, device, and audience. For AI-driven segmentation, allow 7–14 days of onboarding to gather behavioral data. If you have less than 90 days of history, use onboarding questions to collect zero-party data until behavioral patterns emerge.
How often should I update my segment rules?
Dynamic segmentation automatically updates your rules in real time as user behavior and CRM data change. Review your criteria regularly to check that they still work as intended.
Audit contact data quarterly to check its accuracy and remove duplicates. Track conversion rates and engagement trends, then adjust scoring criteria and qualification benchmarks as needed. If you spot segment gaps or performance issues, address them right away - don’t wait for scheduled reports.
What if segmentation improves replies but lowers paid conversions?
This points to a qualification gap: prospects are engaged, but your product may not fit their needs, or your routing may not match buyer intent.
Review route splits for segments with high volume but low conversion. Use Reform’s conditional logic to qualify leads before they reach sales. Check form length and required fields - longer forms can reduce volume while improving lead quality. Compare conversion rates across segments to decide whether to adjust your offer, timing, or CTA.
Related Blog Posts
Get new content delivered straight to your inbox

The Response
Updates on the Reform platform, insights on optimizing conversion rates, and tips to craft forms that convert.



Drive real results with form optimizations
Tested across hundreds of experiments, our strategies deliver a 215% lift in qualified leads for B2B and SaaS companies.
