
.webp)
7 Metrics for Benchmarking Lead Nurturing Workflows


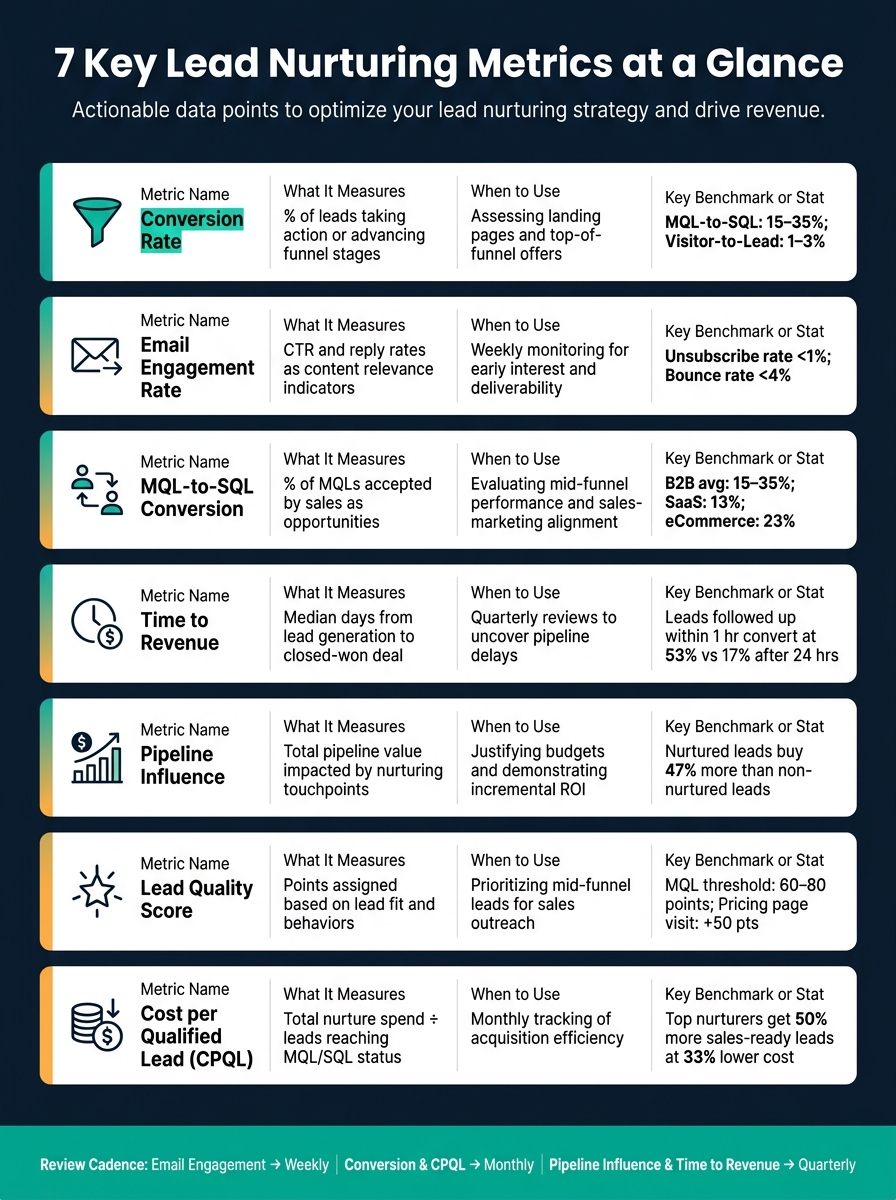
Lead nurturing isn’t just about sending emails or triggering workflows - it’s about moving leads closer to buying. To measure success, you need the right metrics. Here's a quick breakdown of the 7 key metrics every marketer should track:
- Conversion Rate: Tracks how effectively leads move through funnel stages. Benchmarks vary by stage (e.g., MQL to SQL: 15–35%).
- Email Engagement Rate: Focus on click-to-open rate (CTOR) over unreliable open rates. Aim for unsubscribe rates under 1%.
- MQL-to-SQL Conversion: Measures alignment between marketing and sales. Typical B2B rates range from 15–35%.
- Time to Revenue: Tracks how quickly leads become paying customers. Delays often signal content or process issues.
- Pipeline Influence: Evaluates revenue impact of nurture campaigns using metrics like pipeline velocity and incremental lift.
- Lead Quality Score: Combines fit and behavior to prioritize sales-ready leads. Recalibrate quarterly for accuracy.
- Cost per Qualified Lead (CPQL): Calculates efficiency by dividing nurture costs by MQL/SQL counts. Segment by source for better insights.
Key takeaway: These metrics work together to highlight strengths, identify bottlenecks, and optimize budgets. Don't rely on one metric alone - review them collectively for a full picture of your lead nurturing performance.
Marketing foundations: Lead generation & nurturing in B2B || Episode #9
1. Conversion Rate
The conversion rate is a straightforward way to gauge how well your nurturing workflow is performing. It focuses on two main areas: the percentage of recipients who click a link in a nurturing email and complete a specific action, and the rate at which leads progress from one stage of the funnel to the next.
To calculate these rates, you can use two simple formulas:
- For email actions: (Number of leads completing the desired action ÷ Total clicks) × 100
- For funnel progression: (Leads reaching the next stage ÷ Total leads in the current stage) × 100.
However, clicks only matter if they lead to meaningful progress in the funnel. As The Pedowitz Group explains:
"Nurture is effective when it changes conversion and velocity. Everything else is a diagnostic signal."
It's also important to set benchmarks based on the specific stage of your funnel. Conversion rates can vary widely depending on where a lead is in the process. Here are some typical B2B benchmarks:
| Funnel Stage | Benchmark Range |
|---|---|
| Visitor to Lead | 1–3% |
| Lead to MQL | ~31% |
| MQL to SQL | 15–35% |
| SQL to Opportunity | 30–55% |
| Opportunity to Close | 15–40% |
Industry differences play a role, too. For example, MQL-to-SQL conversion rates average 13% for B2B SaaS, 23% for eCommerce, and 26% for Business Insurance. If your MQL-to-SQL rate drops below 10%, it might be time to review your lead scoring criteria or evaluate the relevance of your content, rather than simply trying to generate more leads.
A useful way to assess your benchmarks is by creating a control group. Hold out 5–15% of eligible leads and compare their progression to the nurtured group. This method provides a clearer picture of incremental lift, rather than just tracking overall activity.
Next, we'll dive into email engagement rates to better understand lead behavior and see how they fit into the larger metric framework.
2. Email Engagement Rate
Email engagement rate combines several metrics - like click-through, reply, unsubscribe, and bounce rates - to show how leads are interacting with your content. For example, the click-through rate (CTR) helps determine if your message and call-to-action align with a lead's current needs. Meanwhile, reply rates are a strong indicator of intent, especially in B2B workflows.
Forget about prioritizing open rates. With Apple Mail Privacy Protection and updates like iOS 18.2/18.3, open rates have become unreliable. These updates preload tracking pixels, artificially inflating open rates for over 74% of Apple mobile users. This makes open rate data more of a vanity metric than a useful one.
Instead, focus on the click-to-open rate (CTOR). CTOR measures the percentage of recipients who click a link after actually viewing the email. This metric cuts through the noise caused by preloaded tracking pixels, giving you a clearer picture of engagement.
Email engagement metrics are also key for lead scoring. Assign different weights to interactions, like 2 points for an open, 5 for a click, and 15 for a whitepaper download. On the flip side, use negative scoring to keep your data clean - deduct points for things like 30 days of inactivity or email bounces.
Set clear benchmarks for your campaigns. Aim to keep your unsubscribe rate below 1% and your bounce rate under 4%. If these numbers go beyond these thresholds, it could signal a problem with your content strategy. For instance, your material might not match where your lead is in their buying journey. As Corey Wainwright from HubSpot points out:
"A low click-through rate for a specific segment usually means the nurturing content needs to be tailored more closely to individual personas."
Up next, we’ll dive into the MQL-to-SQL conversion rate to further refine your workflow performance.
3. MQL-to-SQL Conversion
The MQL-to-SQL conversion rate is a key metric that helps gauge how well your workflow is turning Marketing Qualified Leads (MQLs) into Sales Qualified Leads (SQLs). In simpler terms, it shows whether your marketing efforts are generating genuine buying interest or just superficial engagement.
As the Prospeo Team explains:
"MQL to SQL conversion rate tells you whether marketing and sales agree on what 'qualified' means."
For most B2B industries, the benchmark conversion rate ranges between 15% and 35%, though this varies depending on the sector. For instance, Business Insurance often leads with a rate of 26%, while Fintech averages around 11%, and B2B SaaS typically sees about 13%. If your rate consistently falls below 10%, it’s a strong signal to reevaluate your lead scoring system and the content used in your nurturing efforts.
Why Lead Source and Response Time Matter
The source of your leads plays a bigger role than you might think. For example, leads generated through SEO convert to SQLs at an impressive 51%, outperforming email at 46% and PPC at 26%. These numbers highlight the importance of choosing the right channels for your nurturing strategies.
Another critical factor is how quickly your team responds to leads. Leads that receive a follow-up within one hour convert at 53%, compared to just 17% when the response takes longer than 24 hours. Setting clear Service Level Agreements (SLAs) for sales handoffs - and sticking to them - can yield better results than reworking your entire nurturing process.
Keeping Your MQL Pool Accurate
To maintain the quality of your MQLs, it’s essential to recalibrate lead scoring thresholds every quarter. This involves analyzing which leads actually closed and adjusting scores accordingly. Negative scoring can also help, especially for behaviors like 30+ days of inactivity.
Up next, we’ll look at how reducing Time to Revenue can further enhance your overall performance.
4. Time to Revenue
Time to Revenue, sometimes referred to as velocity or time to customer conversion, tracks how quickly leads move from their initial interaction to becoming paying customers. This is done by analyzing timestamps at each lifecycle stage - Inquiry → MQL → SQL → Opportunity → Closed-Won - and calculating the median time it takes to transition between each stage.
This metric is a clear indicator of how efficiently your workflow operates. As The Pedowitz Group explains:
"Nurture is effective when it changes conversion and velocity. Everything else is a diagnostic signal."
In simpler terms, if your content is grabbing attention (e.g., emails are being opened) but isn't speeding up lead progression through the funnel, then it's engaging without driving intent.
A practical way to measure improvement is by using a 5–15% control group to calculate the median "days saved" through faster conversions. This not only validates your processes but also helps pinpoint any bottlenecks in your pipeline.
When Time to Revenue slows down, it often points to problems like mismatched content, weak offers, or poor coordination between marketing and sales. For example, if your MQL numbers are climbing but Sales-Accepted Leads aren't increasing at the same rate, it’s a sign that the marketing-to-sales handoff needs immediate attention before fine-tuning your nurture campaigns. To avoid such issues, monitor velocity on a monthly basis and make adjustments quarterly to keep your pipeline moving smoothly.
Quicker revenue realization also supports other key metrics, such as conversion and engagement rates, making Time to Revenue an essential part of your overall lead nurturing strategy.
sbb-itb-5f36581
5. Pipeline Influence
Pipeline influence goes beyond conversion and engagement metrics, focusing on the real revenue impact of your workflows. It answers a crucial question: Are your nurtured leads turning into actual opportunities and deals? This metric tracks the total pipeline generated, influenced revenue, and the incremental revenue per lead cohort that interacted with your nurture campaigns.
One key concept here is incremental lift, which compares results against a baseline. As The Pedowitz Group explains:
"If you can't show lift against a baseline, you're measuring activity - not effectiveness."
The most effective way to measure this is by comparing a nurtured group of leads to a holdout group (usually 5–15% of leads that don’t receive nurturing). By analyzing the difference in win rates, average contract value (ACV), and opportunity creation between these groups, you can uncover the true incremental lift. Research shows that nurtured leads, on average, make purchases that are 47% larger than those of non-nurtured leads.
Another critical metric tied to pipeline influence is pipeline velocity, which quantifies how quickly revenue moves through your pipeline. The formula for pipeline velocity is:
(Number of Opportunities × Average Deal Size × Win Rate) / Sales Cycle Length.
This metric is straightforward enough for even CFOs to grasp. By tracking pipeline velocity monthly, you can measure how your nurturing efforts are speeding up revenue generation. On a quarterly basis, it’s essential to recalibrate lead scoring with input from sales and RevOps teams, using data from actual closed-won deals.
6. Lead Quality Score
After assessing engagement and conversion efficiency, adding a lead quality score to the mix can refine your focus even further. Think of it as a "hotness score" - a number that indicates how likely a lead is to convert into a paying customer. This score is based on two main factors: fit (details like their role, company size, and industry) and behavior (their actions, such as opening emails, visiting pages, or downloading content). Together, these metrics help determine whether a lead is ready for immediate sales attention or needs more nurturing.
Lead quality scoring builds on engagement and conversion data to pinpoint which leads deserve priority. For example, you might assign +2 points for low-intent actions like opening an email, while high-intent actions - like visiting a pricing page or signing up for a trial - could earn up to +50 points. On the flip side, you’d subtract 10 points for inactivity or bounced emails, ensuring your sales pipeline stays actionable and focused.
To avoid wasting time on unqualified leads, many B2B teams set a threshold of 60 to 80 points for marking a lead as an MQL (Marketing Qualified Lead). Leads that meet or exceed this threshold and show a strong fit are handed off to sales quickly. Those that fall short remain in automated nurture sequences until they show clearer buying intent. This approach helps sales teams avoid chasing the 50–70% of leads who aren’t ready to buy yet.
Another key factor to monitor is multi-stakeholder engagement. When multiple contacts from the same account start interacting with your content, it’s often a sign of active internal evaluation. Adjust the account’s score to reflect this urgency, ensuring timely follow-up.
To keep your scoring system effective, recalibrate it quarterly. As the Prospeo Team explains:
"We've seen teams double their SQL rate just by recalibrating lead scores quarterly. Most teams never recalibrate at all."
During these quarterly reviews, align your scoring model with the traits of leads that have successfully closed. Adjusting point values to better reflect real buying intent ensures your scoring system stays accurate and integrates seamlessly with broader performance metrics discussed in the next section.
7. Cost per Qualified Lead
Cost per qualified lead (CPQL) tells you how much you're spending to turn a lead into someone ready for sales through your nurturing efforts. The formula is simple: divide the total costs of your nurture program by the number of leads that reach MQL (marketing qualified lead) or SQL (sales qualified lead) status. The challenge? Making sure you include all expenses - like content creation, automation platform fees, paid retargeting, and labor hours. This metric is key because it directly measures how efficiently your nurturing efforts are working.
Why does CPQL matter? It shifts the focus from sheer lead volume to actual efficiency. Instead of celebrating a long list of leads, it prompts you to ask, "How much does it cost to prepare just one prospect for sales?" Companies that excel in lead nurturing can generate 50% more sales-ready leads at 33% less cost per lead. That difference can have a huge impact, especially for scaled operations.
To get the most out of CPQL, don’t settle for broad industry averages. Break it down by lead source - SEO, email, and paid ads often have very different costs and conversion rates. Segmenting CPQL by source helps pinpoint which channels are delivering the best efficiency. This kind of analysis uncovers the true value of each channel, making it easier to allocate budgets wisely.
A great way to refine your CPQL is through cohort analysis. For instance, track all the leads that entered a specific nurture sequence in one month, then measure their qualification rates over time. This method gives you a clear, campaign-specific CPQL, avoiding the confusion of blended averages that might hide poor performers.
Also, don’t let "zombie leads" skew your numbers. These are contacts that haven’t engaged in over 90 days. Keeping them in active sequences wastes money on platforms and inflates your CPQL without contributing to your pipeline. Moving them to cold storage or purging them keeps your data clean and ensures your resources are focused where they’ll make the biggest impact.
"Instead of judging nurture programs by open rates alone, you know which tracks actually create incremental pipeline and revenue." - The Pedowitz Group
Comparison Table
7 Lead Nurturing Metrics: Benchmarks, Usage & Limitations
Understanding your lead nurturing performance requires more than just one metric. Each metric provides a different lens, helping you pinpoint current performance levels, identify bottlenecks, or justify budget allocations. The table below organizes seven key metrics, making it easier to match each one to your specific questions or challenges. This breakdown sets the stage for diving deeper into how each metric fits into your overall strategy.
| Metric | What It Measures | When to Use | Key Limitation |
|---|---|---|---|
| Conversion Rate | Percentage of leads taking a specific action or advancing to the next funnel stage | Assessing landing pages and top-of-funnel offers | High conversion rates don’t always equate to high-quality leads |
| Email Engagement Rate | Click-through rates (CTR) and reply rates as indicators of content relevance | Weekly monitoring for early interest and deliverability | Open rates can be misleading due to Apple Mail Privacy Protection |
| MQL-to-SQL Conversion | Percentage of marketing-qualified leads (MQLs) accepted by sales as opportunities | Evaluating mid-funnel performance and sales-marketing alignment | Inconsistent definitions between teams can distort results |
| Time to Revenue | Median number of days from lead generation to closed-won deals | Quarterly reviews to uncover delays in the sales process | Long enterprise sales cycles can skew accuracy |
| Pipeline Influence | Total pipeline value impacted by nurturing touchpoints | Justifying budgets and demonstrating incremental ROI | Requires complex multi-touch attribution for reliability |
| Lead Quality Score | Points assigned based on lead fit and behaviors | Prioritizing mid-funnel leads for sales outreach | Needs quarterly updates to remain relevant |
| Cost per Qualified Lead | Total nurture spend divided by leads reaching MQL/SQL status | Monthly tracking of acquisition efficiency | Overlooks long-term deal quality and lifetime value |
This table highlights how each metric contributes to scaling your lead nurturing efforts, but it also underscores a key insight: easy-to-track metrics, like open rates or basic conversion stats, can be unreliable for making critical decisions.
Carly Miller of Madison Logic sums it up well: "Leadership doesn't fund email CTRs - they fund pipeline growth."
To get the most out of these metrics, stagger your review schedule. Check email engagement weekly, monitor conversion rates and cost per qualified lead (CPQL) monthly, and evaluate pipeline influence and time to revenue quarterly. This approach balances short-term responsiveness with a focus on long-term growth, ensuring you stay aligned with both immediate and strategic goals.
Conclusion
Bringing together individual metrics gives you a clearer understanding of lead nurturing performance. No single metric can tell the whole story. Instead, engagement metrics like CTR and reply rates highlight how well your content connects with your audience. Conversion metrics, such as MQL-to-SQL, reveal how leads are advancing through the funnel, while ROI metrics like pipeline influence and CPQL tie your efforts back to revenue.
The key is understanding how these metrics interact. As Corey Wainwright from HubSpot wisely notes:
"Lead nurturing metrics are most valuable when reviewed together rather than in isolation."
For instance, high engagement but low pipeline movement might signal a disconnect between your content and the audience's intent - not an issue with traffic. This kind of insight only emerges when you evaluate metrics across all categories simultaneously.
It’s worth noting that nurtured leads tend to make 47% larger purchases compared to non-nurtured leads. However, achieving this requires pinpointing where your funnel is thriving and where it might be stalling.
To stay on top of things, follow a consistent review schedule: check engagement metrics weekly, conversion metrics monthly, and pipeline impact quarterly. The goal isn’t to overwhelm yourself with dashboards but to make quicker, smarter decisions at every stage of your funnel. This layered approach ensures your lead nurturing strategy stays both effective and adaptable.
FAQs
Which 1–2 metrics should I prioritize first?
To truly assess your content's performance, start by looking at the Lead-to-MQL conversion rate and pipeline velocity.
The conversion rate helps you determine if your content is pulling in the right audience - those who are genuinely interested - rather than just creating empty buzz. On the other hand, pipeline velocity measures how quickly prospects progress through key stages, such as moving from MQL (Marketing Qualified Lead) to SQL (Sales Qualified Lead) and eventually to closed deals.
By concentrating on these metrics, you can gauge the actual business impact your content is driving, rather than just chasing surface-level engagement.
How do I set up a holdout group for incremental lift?
To gauge incremental lift, set aside 5–15% of your eligible leads as a holdout group. These leads should not be included in your nurture workflows. Then, compare their performance against nurtured leads over the same timeframe. Pay close attention to key metrics such as stage progression, velocity, and opportunity creation. This approach helps you understand the real impact of your nurturing efforts and ensures that conversions are not mistakenly credited to your program.
How often should I recalibrate lead scoring thresholds?
It's important to revisit your lead scoring thresholds every quarter. By doing so, you can ensure they align with your revenue targets and prevent any bottlenecks in your pipeline. Set up regular meetings between your sales and marketing teams to evaluate performance based on closed deals. This collaborative approach keeps everyone on the same page and ensures your scoring criteria remain effective.
Tools like Reform can make this process smoother. With real-time analytics, you can monitor lead quality and engagement directly from your forms, giving you the insights needed to fine-tune your strategy.
Related Blog Posts
Get new content delivered straight to your inbox

The Response
Updates on the Reform platform, insights on optimizing conversion rates, and tips to craft forms that convert.


Drive real results with form optimizations
Tested across hundreds of experiments, our strategies deliver a 215% lift in qualified leads for B2B and SaaS companies.
