
.webp)
How to Choose Features for Predictive Lead Scoring


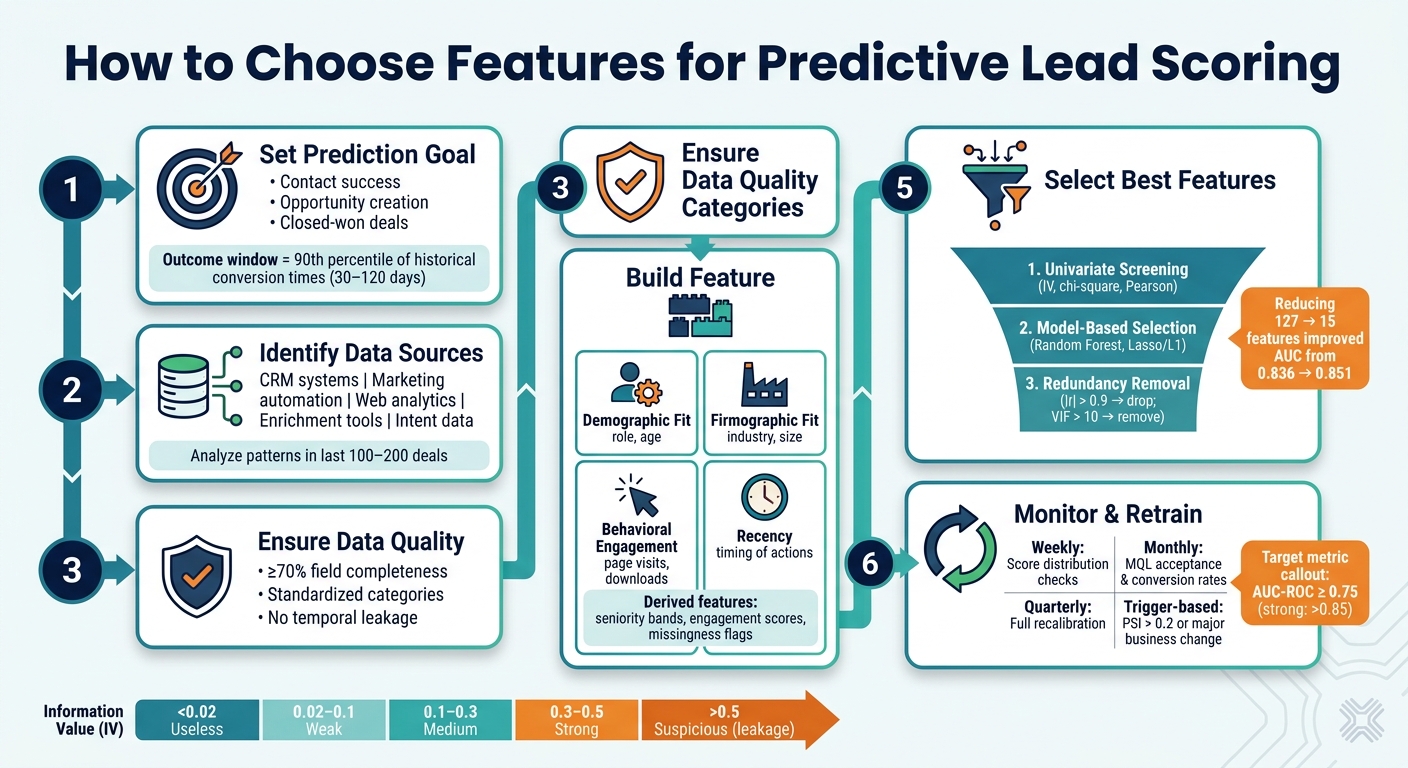
Predictive lead scoring helps sales teams prioritize leads by assigning a conversion probability based on historical data and machine learning. The key to success? Selecting the right features. Poor feature selection can lead to inaccurate predictions and mistrust from sales teams. Here’s a quick breakdown:
- Start with a clear goal: Define what you want to predict (e.g., closed-won deals or qualified leads).
- Use multiple data sources: CRM systems, marketing platforms, web analytics, and enrichment tools are great starting points.
- Ensure data quality: Fields should be at least 70% complete, standardized, and free from temporal leakage.
- Build and refine features: Include demographic, firmographic, behavioral, and recency data. Create derived features like engagement scores or seniority bands for deeper insights.
- Validate features quantitatively: Use techniques like Information Value (IV), random forest importance, and Lasso regression to identify the most predictive features.
- Monitor and maintain: Regularly check for data drift and retrain models as needed to ensure accuracy over time.
Predictive Lead Scoring: Feature Selection Framework
Setting Up Predictive Lead Scoring Using Machine Learning
Defining Goals, Data Sources, and Preconditions
Effective predictive lead scoring starts with clear goals and thorough data checks. Skipping this foundational step is a common reason why models fail when deployed.
Setting a Clear Prediction Goal
First, ask yourself: what exactly do you want to predict? As Malay Gupta, Partner and Head of Operations and Growth at Growleads, explains:
"Marketing is scoring for interest and sales is qualifying for urgency. Those are fundamentally different things."
Your prediction goal should align with the decision the score will guide. For example:
- Routing leads to sales reps? Focus on contact success.
- Choosing between human follow-up and automated nurture? Optimize for opportunity creation.
- Determining lead pricing or prioritizing high-value leads? Target closed-won deals.
Once you’ve clarified your goal, define your outcome and observation windows. A good rule of thumb is to set the outcome window at the 90th percentile of historical conversion times, which typically ranges from 30 to 120 days. Clearly label your positive outcomes (e.g., closed-won deals) and negative outcomes to ensure consistency.
With your goal in place, the next step is identifying the data sources that will provide the signals you need.
Identifying Your Data Sources
Pinpoint where your data resides. B2B teams often pull from multiple systems, each offering unique insights. Common sources include:
- CRM systems: Provide details like stage history, rep activity, and deal age. For U.S.-specific models, fields like USD deal value and account owner are key.
- Marketing automation platforms: Track email engagement, form submissions, and timezone-based activity.
- Web analytics: Capture website behavior, such as visits to pricing or demo pages and time spent on site.
- Enrichment tools: Add context with data like employee count, revenue, and tech stack. U.S.-specific fields include ZIP codes, state identifiers, and NAICS codes.
- Intent data: Highlight surges in interest or competitor research, offering insights into U.S. market trends.
To build a strong foundation, analyze patterns in your last 100–200 deals. Look for trends in job titles, company sizes, and behaviors that led to successful outcomes. For U.S.-based models, cross-check IP geolocation against ZIP codes and states. Discrepancies here can flag low-quality or even fraudulent leads.
Once your data sources are mapped, it’s time to assess their quality.
Verifying Data Quality
Data quality is often overlooked, but incomplete or inconsistent data can undermine even the most advanced models. Siddharth Gangal, Founder of Fairview, highlights this issue:
"A model trained on CRM data where 40% of deal sizes are blank... will produce unreliable scores regardless of the sophistication of the algorithm."
Here’s how to ensure your data is ready for modeling:
- Completeness: Fields should be at least 70% filled. If not, consider enriching the data with a third-party provider or removing the field entirely.
- Standardization: Categorical fields like industry or state should use consistent values. For example, avoid mixing terms like "Financial Services", "Fin Svcs", and "finance", as this can confuse your model.
- Avoid temporal leakage: Ensure no field contains information that wasn’t available when the lead was first submitted. Otherwise, the model may perform well historically but fail in real-world scenarios.
Building a Candidate Feature List
Once you've mapped out your data sources and checked their quality, the next step is to compile a list of all possible features. Start broad - include everything that might be relevant - and then refine the list later. This initial, wide-ranging catalog is the foundation for selecting and fine-tuning features in the next stages.
Grouping Features by Category
Organizing features into categories makes the process more manageable and helps identify any gaps early. A good starting point is to divide features into these four categories:
- Demographic Fit: Information about the individual lead (e.g., age, role).
- Firmographic Fit: Context about the company (e.g., industry, size).
- Behavioral Engagement: Actions taken by the lead (e.g., page visits, downloads).
- Recency: When these actions occurred.
Here’s a helpful way to think about your data sources:
"The warehouse captures what the lead showed you. The CRM captures what the lead told you." - Adrienne Vermorel
In addition to these, consider creating a negative signals category. Features like email bounces, unsubscribes, and long periods of inactivity can be just as important as positive engagement. Without these, inactive leads might still appear valuable, skewing your scoring model.
Next, take a closer look at how data from forms can enhance your predictive features.
Using Form Data as Predictive Features
Form data often provides the first structured insights about a lead, making it a rich source of predictive features. Fields like job role, company size, budget range, and U.S. state aren’t just basic details - they’re powerful indicators of fit.
However, the quality of this data depends on how it’s collected. For example, a free-text "State" field can lead to inconsistent entries like "CA", "California", or "Cali", which a model might treat as entirely different values. Tools like Reform solve this by using structured inputs, such as dropdown menus for U.S. states, and by validating email addresses automatically. This ensures clean, consistent data reaches your CRM without extra processing. Reform also offers lead enrichment and spam prevention, filling in missing firmographic details and filtering out low-quality submissions before they reach your dataset.
Often overlooked fields like phone type (mobile vs. landline) or email domain (corporate vs. personal) can also carry strong predictive value.
Creating Derived Features from Raw Data
Once you’ve categorized the standard inputs, the next step is to create derived features - metrics built from raw data that offer deeper insights. These derived metrics often outperform the raw data they’re based on.
Here are some examples of high-value derived features:
- Seniority bands: Use a SQL
CASEstatement to group messy job titles into tiers (e.g., C-Level, VP, Manager). Leads with VP-level titles often show a 1.75x increase in conversion rates compared to baseline. - Engagement scores: Assign weights to page visits based on intent - e.g., pricing pages count 3x, blog posts count 1x - and roll them into a single score. Leads who visit integration documentation pages three or more times within two weeks can show a 3.2x increase over baseline.
- Interaction features: Combine metrics for a fuller picture, such as multiplying
session_countbytime_on_siteto measure total engagement. Similarly, flag leads that pass both email and phone validation by combiningvalid_email × valid_phone. - Missingness indicators: Create binary flags for missing data (e.g.,
is_revenue_missing). The absence of information can itself be predictive; for instance, bootstrapped companies often skip funding details. - Cyclical time features: Instead of using raw integers for time-based data (e.g., hour of submission), apply sine and cosine transformations. This helps the model understand that 11 PM and midnight are adjacent, not 23 hours apart.
| Feature Type | Practical Example | Why It Helps |
|---|---|---|
| Seniority Band | C-Level, VP, Director from job titles | Normalizes inconsistent titles into groups |
| Engagement Score | Pricing page views × 3, blog × 1 | Weights signals based on intent |
| Interaction Feature | session_count × time_on_site |
Combines frequency and duration of engagement |
| Missingness Flag | is_revenue_missing = 1 |
Turns missing data into a usable signal |
| Cyclical Time | Sin/cos of submission hour | Maintains time adjacency for the model |
sbb-itb-5f36581
Applying Quantitative Feature Selection Methods
Once you’ve compiled a solid list of candidate features, the next step is narrowing it down without losing the predictive power of your model. Surprisingly, fewer features can sometimes lead to better performance. For instance, in one SaaS churn prediction model, reducing the feature set from 127 to just 15 boosted the AUC score from 0.836 to 0.851, while also slashing training time from 47 minutes to just 90 seconds. To achieve this, a three-step pipeline - filtering, model-based refinement, and redundancy cleanup - can help you refine your feature set into a lean, high-performing group.
Univariate Screening Techniques
Start by applying simple, model-independent tests to quickly identify features that lack predictive value. Use Pearson correlation for numeric features, chi-square tests for categorical variables, and Mutual Information to capture non-linear relationships.
For lead scoring, Information Value (IV) is particularly useful. It measures how well a feature separates converted leads from non-converted ones. Here’s a quick reference:
| Information Value (IV) | Predictive Power |
|---|---|
| < 0.02 | Useless |
| 0.02 to 0.1 | Weak |
| 0.1 to 0.3 | Medium |
| 0.3 to 0.5 | Strong |
| > 0.5 | Suspicious - potential data leakage |
Before diving into these tests, apply a variance threshold as a baseline filter. Features where 99.5% of observations share the same value add no meaningful information and should be dropped immediately.
Model-Based Feature Selection
Once you’ve filtered out the weakest features, refine your list further by evaluating how each feature contributes to model performance. Random forest importance scores, which rely on Gini impurity, can give you a quick ranking of feature relevance. However, these scores often favor high-cardinality features, so balance them with permutation importance, which measures the drop in model performance when a feature's values are shuffled. Though slower, permutation importance provides a more accurate picture of each feature's value.
For a more automated approach, try L1-regularized logistic regression (Lasso). Lasso works by shrinking the coefficients of less useful features to zero, effectively removing them from the model.
"Feature engineering creates candidates. Feature selection decides which ones earn a seat at the table." - DataField.Dev
Handling Redundant and Correlated Features
Even after model-based selection, you might find features that overlap in what they measure. For example, total_page_views and total_session_count often correlate strongly. When the absolute correlation (|r|) exceeds 0.9, it’s best to drop one of the features. If the correlation falls between 0.7 and 0.9, test both options to see which performs better. Use the Variance Inflation Factor (VIF) as a guide - if a feature’s VIF exceeds 10, consider removing it. When deciding which to keep, prioritize features with fewer missing values, higher variance, or stronger univariate correlations.
Validating and Maintaining Your Feature Set
Once you've built and fine-tuned your candidate features, the next step is ensuring they deliver measurable results. This involves aligning with business goals and conducting thorough testing.
Getting Business Buy-In on Your Features
Even the best feature set can fall short if sales and marketing aren't on the same page. As Malay Gupta, Partner and Head of Operations and Growth at Growleads, explains:
"We have seen companies with 50,000 MQLs per month and a sales team that considers 200 of them worth calling. The problem is never the volume. The problem is that marketing is scoring for interest and sales is qualifying for urgency."
Before finalizing your features, take the time to align with both teams. Ensure each signal in your feature set directly ties to an actionable buying indicator. This shared understanding of what qualifies a lead isn't just a nice-to-have - it’s what ensures your model is targeting the right outcomes. Once you’ve secured alignment, you can move on to validating the model with historical data.
Backtesting and Running a Pilot
After achieving team alignment, validate your model by backtesting it with historical data. Use temporal splitting for this process: train the model on data from months 1–12 and test it on data from months 13–15. Avoid random data splits, as they can lead to temporal leakage, where the model inadvertently learns from future data. This often results in overly optimistic performance estimates that won't hold up in practice.
Aim for an AUC-ROC score of at least 0.75 for a useful lead scoring model, with scores above 0.85 being especially strong. Additionally, check the model's calibration. For example, if the model assigns a 30% probability to a lead, approximately 30% of those leads should convert. A calibration curve, also known as a reliability diagram, can help visualize this.
When testing in a live setting, use shadow scoring. This involves running the new model alongside your existing process without influencing lead routing. It allows you to safely compare the new model's performance on real traffic. Skipping this step can be costly - one IT services provider launched with only 43% accuracy due to insufficient testing. After three months of data cleaning and feature validation, they improved accuracy to 76%.
Once the pilot demonstrates reliable accuracy, focus on maintaining your feature set through regular monitoring and retraining.
Monitoring Features and Retraining the Model
Predictive models degrade over time if left unchecked. Many models experience performance decline within 3 to 6 months without regular updates. Two key types of drift to monitor are:
- Input drift: Changes in feature distribution, such as an unexpected increase in mobile form submissions.
- Output drift: A weakening relationship between predicted scores and actual conversions.
To detect input drift, leverage the Population Stability Index (PSI). A PSI score above 0.2 indicates a significant distribution shift and signals the need for retraining. Beyond scheduled updates, retrain your model immediately after major changes, such as new product launches, pricing adjustments, or shifts in your Ideal Customer Profile (ICP).
Here’s a suggested schedule for ongoing monitoring and maintenance:
- Weekly: Check score distributions for unexpected patterns or anomalies.
- Monthly: Review MQL acceptance rates and the conversion rates of high-scoring leads.
- Quarterly: Perform a full recalibration to update feature weights using new data.
- Trigger-based: Retrain the model when PSI exceeds 0.2 or after significant business changes.
In addition, conduct reverse analysis regularly. If more than 20% of your closed-won deals have scores below your MQL threshold, it’s a sign the model is missing critical buying signals and needs adjustment. As Siddharth Gangal of Fairview emphasizes:
"A scoring model that is not actively maintained decays faster than the leads it is supposed to evaluate."
Key Takeaways for Choosing Lead Scoring Features
When it comes to selecting lead scoring features, the groundwork starts long before you dive into building a model. It’s all about preparation - defining your goals, reviewing your data, and crafting meaningful features. Start by clearly identifying what you’re predicting. For example, models built for "closed-won deals" will look very different from those focused on "qualified leads." Also, take a hard look at your data. Fields should be at least 70% complete; otherwise, enrich or remove incomplete ones. A high-end model trained on poor-quality data won’t outperform even a basic rule-based system.
Create new features from raw data that provide deeper insights. For instance, metrics like a "7-day rolling engagement score" or "days since last activity" can highlight momentum better than static data points. Combine these with behavioral signals - such as visits to pricing pages, demo requests, or form submissions - and weight features to reflect recent actions. Tools like Reform can help ensure structured, reliable data for these behavioral signals.
Once your features are ready, validate them using temporal splits and holdout testing. Evaluate performance with metrics like AUC-ROC, and establish a regular routine for monitoring. As Jeff Ignacio from RevOps Impact wisely notes:
"The model you build today will start decaying the moment you deploy it. That is not a failure of the model. It is the nature of a business that changes over time."
To keep your lead scoring accurate, schedule weekly checks on data distribution, monthly reviews of conversion trends, and quarterly recalibrations. Retrain your model immediately after any major business shifts. Maintaining discipline in validation and upkeep is the key to long-term success with lead scoring.
FAQs
How many features should my lead scoring model use?
When deciding on the number of features for your model, it’s important to base this on your historical closed-won deal volume rather than setting an arbitrary limit. A good rule of thumb: you’ll need 10–20 positive outcomes per variable for the model to perform well. For instance, if you’re working with 40 variables, you should have between 400 and 800 closed-won deals to ensure reliability.
Experts often recommend keeping models streamlined. For mid-market businesses, having 5 to 8 active variables tends to yield solid results. Prioritize features that show a strong correlation with buying behavior to make your model as effective as possible.
How do I prevent data leakage in lead scoring features?
To keep your predictive lead scoring accurate and reliable, it's crucial to ensure that the feature values only include data available at the time of scoring. One of the most frequent pitfalls is temporal data leakage - this happens when models inadvertently use behavioral data collected after a lead is submitted.
To prevent this, you need to carefully structure your dataset. Start by defining an observation window that ends precisely at the moment of lead submission. Any events that occur after submission, such as additional page visits or content downloads, should be excluded. This ensures your model isn't influenced by future data during training, keeping predictions realistic and aligned with real-world scenarios.
How often should I retrain a predictive lead scoring model?
Adopting a continuous retraining approach is far more effective than sticking to a rigid schedule. In B2B contexts, models can start to degrade within just 90–180 days as market conditions shift. To stay ahead, monitor performance every quarter by comparing conversion rates against lead scores.
Be proactive in tackling issues like data or concept drift, which often emerge within 4–16 weeks. These shifts can impact your model's accuracy, so targeted updates are key to keeping things on track. Tools like Reform can help by providing lead enrichment and validation, ensuring your data remains accurate and your scoring stays reliable.
Related Blog Posts
Get new content delivered straight to your inbox

The Response
Updates on the Reform platform, insights on optimizing conversion rates, and tips to craft forms that convert.


Drive real results with form optimizations
Tested across hundreds of experiments, our strategies deliver a 215% lift in qualified leads for B2B and SaaS companies.
