
.webp)
Hyperparameter Tuning for Lead Scoring Models



If I tune the right settings, a lead scoring model can sort leads better, miss fewer good fits, and send sales after the leads most likely to convert.
Here’s the short version: I first lock the target label, the conversion window, and the prediction time. Then I split data by time, check for leakage, test a simple baseline like logistic regression, and only then tune tree-based models. I judge results with AUC, precision at the top 10%, lift, and calibration - not plain accuracy.
What I’d focus on right away:
- Set one clear goal: MQL, SQL, opportunity, or closed-won
- Leave out recent leads that have not had time to convert, such as the last 90 days
- Use older leads for training and newer leads for validation/testing
- Keep accounts grouped in cross-validation when many leads come from the same company
- Start simple with logistic regression before moving to random forests or boosting
- Tune a small set of settings like
C,max_depth,learning_rate,class_weight, and tree count - Check overfitting by comparing training vs. validation results
- Map probabilities to CRM scores like 0–100 and set bands based on team capacity
- Review the model on a schedule with monthly score checks and deeper quarterly reviews
A few numbers from the article give a solid starting point: 70% / 15% / 15% train-validation-test splits, 5-fold or 10-fold CV when data is thin, learning_rate around 0.01–0.3, and tree depth often around 3–6 for boosting.
In short, I would treat tuning as a repeat process: clean input data, careful splits, tight search ranges, business-focused metrics, and score bands that sales can use without guesswork.
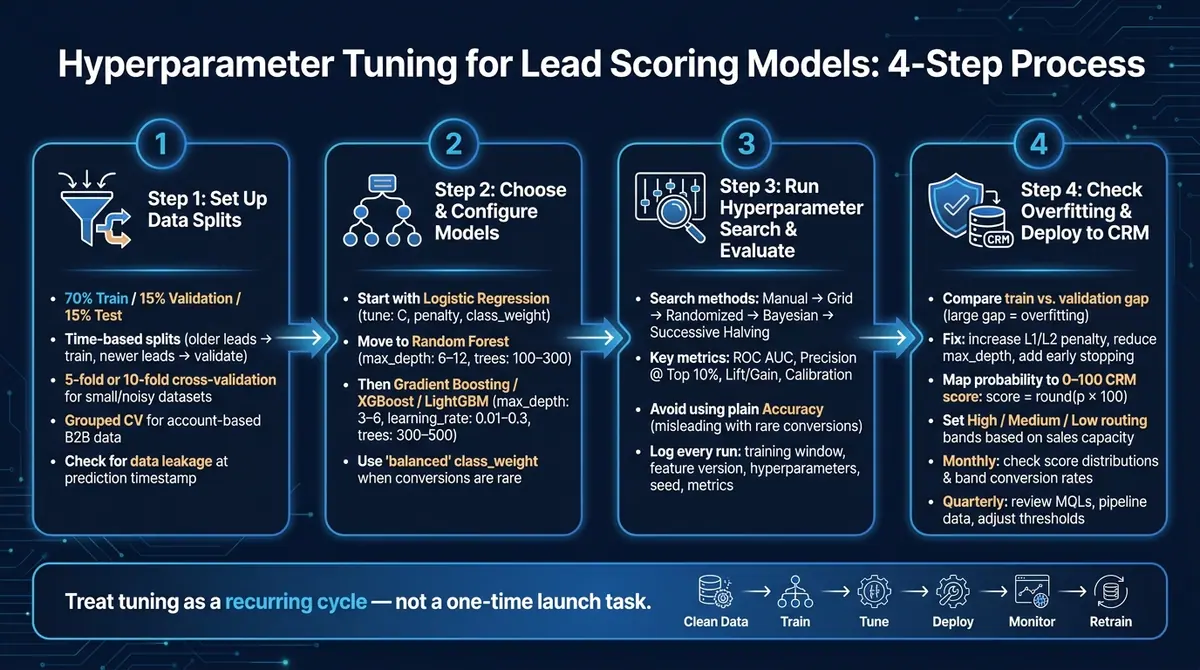
Lead Scoring Model Tuning: 4-Step Process Guide
Hands-on Hyperparameter Tuning | Grid Search
sbb-itb-5f36581
Step 1: Set up train, validation, and test splits that match real lead flow
Start with a three-way split: about 70% train, 15% validation, and 15% test. The training set teaches the model. The validation set helps you tune it. The test set is for the final read on performance, used once. If the split is off, every tuning result after that gets shaky.
Use time-based and stratified splits
Random splits don’t match how lead scoring works in practice. In production, you score new leads using patterns learned from older ones. So train on older leads and validate on newer leads to mirror that setup.
If positive outcomes are rare, stratify inside each time window so each split keeps a similar conversion rate. Using optimized conversion paths ensures the data collected is consistent and high-quality. That helps keep precision, recall, and AUC more stable during tuning, instead of bouncing around based on which leads happened to land in a given month.
Add cross-validation when data is limited or noisy
Use 5-fold or 10-fold cross-validation when the dataset is small or noisy.
Fold setup matters just as much as the number of folds. In account-based B2B sales, several leads may come from the same company. In that case, use grouped cross-validation. Put all leads from one account into the same fold so the tuning results show how the model does on net-new accounts, not just new contacts from companies it has already seen.
Check for data leakage before tuning starts
Leakage is a common reason a model looks great in validation and then falls apart after launch. Watch for fields that are only known after the prediction point, like post-conversion status or delayed enrichment data.
Set a clear prediction timestamp - usually when the lead is created or when a form is submitted - and check every feature against that moment. One red flag is a sharp metric drop after removing a small set of fields. If that happens, inspect those fields for leakage.
Fit scaling, encoding, and imputation on the training data only. Then apply those fitted steps to the validation and test sets. That keeps info from the full dataset out of your evaluation.
Once your splits are clean and leakage is handled, model choices and hyperparameter tuning start to mean something.
Step 2: Choose models and hyperparameters that fit lead scoring
Once your data split is clean, start with the simplest model that matches the signals you have. Then tune only the settings that change ranking and calibration.
Start with logistic regression as a baseline
Logistic regression is a solid place to begin for lead scoring. It gives you probabilities you can map straight into score bands, and the coefficients are easy to explain. That matters when sales and marketing want to know why a lead was marked "high priority" or "nurture."
Most of the tuning work comes down to three hyperparameters:
C: start at1.0, then lower it if validation performance falls behind training. Use a smallerCwhen the model starts to overfit.penalty: use L2 by default. Switch to L1 if you want the model to drop noisy fields.class_weight: usebalancedwhen conversions are rare.
Don’t jump to a more complex model too early. If the baseline still misses clear interaction effects, that’s the time to try trees.
Tune tree-based models for non-linear CRM and behavioral signals
Tree-based models can pick up patterns logistic regression often misses. They work well when your inputs mix CRM fields, behavioral events, and enrichment data.
For random forests, focus on max_depth, min_samples_leaf, and max_features. For gradient boosting models like XGBoost and LightGBM, treat learning rate and number of trees as a pair, and use early stopping on the validation set.
| Parameter | Random Forest | Gradient Boosting |
|---|---|---|
| Number of trees | 100–300; increase until AUC stabilizes | 300–500 at lr=0.05; use early stopping |
| Max depth | 6–12 | 3–6 |
| Subsampling | max_features="sqrt" |
subsample=0.8, colsample_bytree=0.8 |
| Min samples per leaf | 10–50 to avoid tiny, unstable splits | 10–30 |
For gradient boosting, keep max_depth in the 3–6 range. Go deeper and the model can start memorizing instead of learning patterns that hold up.
Follow a simple-to-complex model workflow
Train logistic regression first. Then compare it against tree-based models on the exact same validation split. Let the simpler model set the baseline before you move up the ladder.
At this stage, lock in your preprocessing steps, score bands, and baseline metrics, including:
- AUC
- Precision at the top 10% of scores
- Calibration against actual close rates
Also, don’t choose a model on AUC by itself. A higher AUC can look good on paper but still miss the business goal. What matters more is lift in top-score conversion. That’s the metric that tells you whether your best leads are actually rising to the top.
Only move to gradient boosting if the random forest still has room to improve and your dataset is rich enough to support it, such as multi-step form responses, detailed behavioral events, and enriched firmographics. In the end, use the model that does the best job ranking top-of-funnel leads and producing calibrated score bands.
Step 3: Run hyperparameter search and evaluate models with the right metrics
With your splits set and a baseline ready, the next move is tuning on the validation set and judging results with business-facing metrics.
Compare search methods by speed, search-space coverage, and compute cost
Pick a search method based on one simple reality: how expensive is each training run, and how fast do you need a usable result?
Manual tuning is fine for quick baseline checks. Grid search tries every combination in a set grid, so it’s thorough, but costs can climb fast as you add more parameters. Randomized search is often the default because it gives broad coverage without testing everything. Bayesian optimization makes sense when each run is expensive. Successive halving can cut compute use by dropping weak trials early.
| Method | How It Searches | Best Use Case | Tradeoffs for Lead Scoring |
|---|---|---|---|
| Manual Tuning | Human-selected values based on intuition | Initial baseline, logistic regression | Hard to reproduce and not scalable |
| Grid Search | Exhaustive search through a predefined grid | Small parameter spaces | Slow and computationally expensive |
| Randomized Search | Samples randomly from a distribution | Fast iteration; smaller tree-based models | Broad coverage, but may miss the best setting |
| Bayesian Optimization | Uses past results to choose the next trial | Expensive models where each run counts | More efficient, but sequential and harder to operationalize |
| Successive Halving / Hyperband | Stops weak trials early and increases budget for promising ones | Large datasets with many behavioral signals | Efficient, but requires a budget setting |
Track metrics that match sales efficiency and marketing coverage
Accuracy can fool you in lead scoring. Conversions are rare, so a model can post a strong-looking accuracy number just by predicting that nobody converts. That doesn’t help sales decide who to call first.
Use ranking, conversion, and calibration metrics instead. Skip accuracy as a model selection metric.
For lead scoring, choose models based on ranking lift and day-to-day use, then check calibration before routing leads by score.
| Metric | Business Question It Answers | When to Prioritize |
|---|---|---|
| ROC AUC | How well does the model rank good leads above bad ones overall? | Early experimentation and model comparison |
| Precision | Of the leads we flagged as hot, how many actually converted? | Limited sales capacity |
| Recall | What share of all real converters did we catch? | When missing qualified leads is costly |
| F1-Score | Is the model balanced between false positives and false negatives? | When both error types matter |
| Lift / Gain | How much better than random is the model in the top 10%–20% of leads? | Proving model value to sales and marketing leadership |
| Calibration | Does a score of 0.70 really mean about a 70% conversion likelihood? | Score-based routing, nurture triggers, CRM thresholds |
Set practical search ranges and logging rules
Search ranges should be tight enough to keep tuning efficient, but wide enough to surface useful tradeoffs.
For learning_rate, a log-scale range of 0.01 to 0.3 is a solid place to start. For max_depth, stay between 3 and 10. In many cases, shallower trees generalize better on noisy CRM and behavior data. With n_estimators, don’t just guess a fixed tree count. Pair it with the learning rate and use early stopping on the validation set.
Logging matters more than people think. If runs aren’t logged the same way every time, comparison gets messy fast.
For each tuning run, log:
- training and validation windows (MM/DD/YYYY)
- feature version
- model family
- hyperparameters
- seed
- validation metrics
- threshold
- split strategy
- early-stopping rule
Use the same log format across every experiment so results line up cleanly across channels and segments.
Then take the best setup to the holdout set before checking for overfitting and CRM fit.
Step 4: Check for overfitting and connect tuned scores to CRM workflows
Diagnose and reduce overfitting before launch
After validation, make sure the model still performs well on unseen leads before you send scores into the CRM.
Start by comparing training and validation performance using the same holdout metrics you used during tuning. If the gap is large, folds swing around a lot, or learning curves keep drifting apart, you're likely dealing with overfitting.
A big train-vs.-validation gap usually means the model has started to memorize patterns instead of learning ones that hold up. And if performance varies a lot from one fold to another, the model may not be stable across different time windows.
Here’s a simple way to read the warning signs:
| Overfitting Symptom | Likely Cause | Practical Fix |
|---|---|---|
| Large train vs. validation metric gap | Model too complex; weak regularization | Increase L1/L2 penalty; reduce max_depth; add early stopping |
| High variance across CV folds | Time-window sensitivity; too little data | Reduce complexity; favor stable features |
| A single odd feature dominates importance | Data leakage | Audit all features; remove post-conversion fields; retrain |
For tree-based models, it often helps to lower learning_rate into the 0.03–0.05 range, set subsample and colsample_bytree between 0.6 and 0.8, and let early stopping on the validation set decide the final tree count instead of locking it in by hand.
Map model outputs to scores, bands, and thresholds in the CRM
Once the model is stable, turn its probability output into something the sales team can act on.
Store the raw probability in a dedicated CRM field such as Lead_Conversion_Probability. Then convert it into a 0–100 score using simple linear scaling: score = round(p × 100). From there, set High, Medium, and Low routing bands based on sales capacity and past conversion rates.
The key is to test those thresholds against historical conversion lift, then tune them until routing lines up with both team capacity and performance goals.
Document the current thresholds, the model version, and the training window in your internal docs. That way, the scoring logic stays clear and easy to update when things change.
Use cleaner form data and integrations to improve score reliability
All of this depends on the data coming in. If the form inputs are messy, the scores will be too.
Missing job titles, wrong values, and noisy attributes weaken the features the model learns from. And no regularization setting can rescue a bad training set. This is where Reform fits into the rollout: cleaner capture, validation, enrichment, and CRM sync help improve feature quality and cut down on mismatch between training data and live CRM data.
When production inputs stay aligned with the data the model was trained on, score bands are much more likely to hold up in day-to-day use.
Conclusion: Make tuning a recurring part of your lead scoring process
Treat hyperparameter tuning as a regular cycle, not a one-time launch task.
Once the model is live, review it on a set schedule so you can spot drift early. Monthly check-ins should look at score distributions, band conversion rates, and whether CRM automations still send leads to the right place. Quarterly reviews should go further: look at recent MQLs, pipeline data, and band-level acceptance and close rates. Then adjust thresholds if higher scores no longer beat lower ones.
To compare model versions cleanly, log each cycle the same way. Keep a versioned record with the training date, label definition, key hyperparameters, score thresholds, validation metrics, and pipeline value ($) for each band. That makes it much easier to see whether a performance change came from the model, the data, or a shift in buyer behavior. It also gives you a clear rollback point if something breaks.
Cleaner inputs also make the next retraining cycle easier to trust. Keep capture, enrichment, and CRM sync in line with the training data. If forms are part of your funnel, Reform can help you get cleaner capture and smoother CRM sync.
FAQs
How much lead history do I need to tune a model well?
There’s no set minimum amount of lead history you need to tune a model well. What matters more is data quality, not the algorithm itself.
If your CRM data has big gaps or lots of missing values, your scoring will struggle no matter how fancy the model is. Keep the data clean and complete. Then test and adjust the model over time using performance metrics and feedback from sales.
When should I retrain a lead scoring model?
Retrain your lead scoring model when you spot clear performance decay. For example, Tier 1 leads may stop converting, or Tier 3 leads may start winning deals on a regular basis.
Business conditions change after deployment. That’s why it helps to review the model with sales every quarter. If scores no longer line up with actual team capacity or your organization’s SLAs, it’s time to iterate.
How do I choose the right score cutoff for sales?
Make sure Sales and Marketing agree on what counts as a hot lead. Then review scores every quarter with conversion analysis to check that the model is identifying sales-ready leads with accuracy.
The cutoff should require multiple meaningful brand interactions and fit your team’s capacity and service level agreements, so Sales can follow up fast instead of just getting more lead volume.
Related Blog Posts
Get new content delivered straight to your inbox

The Response
Updates on the Reform platform, insights on optimizing conversion rates, and tips to craft forms that convert.



Drive real results with form optimizations
Tested across hundreds of experiments, our strategies deliver a 215% lift in qualified leads for B2B and SaaS companies.
