
.webp)
Predictive Scoring Models: Performance Benchmarks


Predictive scoring models use machine learning to identify leads most likely to convert into customers, saving sales teams time and improving results. Key metrics like AUC-ROC, precision, and recall help assess their performance. Benchmarks such as an AUC-ROC of 0.80+, precision above 70%, and a conversion lift of 25% indicate strong results. Industries like B2B SaaS and financial services have seen conversion rates improve by 20-30% with these models.
To optimize models:
- Regularly refresh data and use time-based decay to maintain accuracy.
- Monitor false positives and feedback from sales teams.
- Focus on clean, reliable data and align scoring with workflows.
The right model - whether logistic regression, random forests, or gradient boosting - depends on your priorities (speed, accuracy, or interpretability). By following these benchmarks and strategies, you can improve lead quality, boost conversions, and streamline sales processes.
Predictive Scoring Model Performance Benchmarks and Comparison Guide
Key Performance Metrics for Predictive Models
Core Metrics Explained
AUC-ROC (Area Under the Receiver Operating Characteristic Curve) gauges how effectively your model distinguishes between leads that convert and those that don’t. A perfect score of 1.0 means the model separates them flawlessly, while a score of 0.5 is no better than guessing. This metric highlights how well your model ranks potential leads.
Precision shows the percentage of leads flagged by the model that actually convert, helping reduce wasted sales efforts. On the other hand, Recall (or sensitivity) measures how many actual high-value leads the model identifies. Missing out on a key prospect (false negatives) can be costly, especially in enterprise sales, making recall particularly important.
The F1-score balances precision and recall by combining them into a single metric, making it especially useful when both false positives and false negatives are equally significant. Log loss (cross-entropy loss) evaluates the model’s confidence in its predictions, penalizing incorrect predictions made with high certainty. Lastly, conversion lift quantifies the real-world impact of the model by showing how much it improves conversion rates compared to a baseline, such as a traditional rule-based system.
"A model with 75% accuracy that sales teams trust and use daily beats a 90% black box any day." - Leadsourcing.co
Standard accuracy can be misleading for imbalanced datasets. For instance, if only 1% of your leads convert, a model predicting that no one converts could still achieve 99% accuracy. Metrics like AUC-ROC and F1-score are much better suited for accurate lead scoring.
Next, we’ll explore key industry benchmarks that define strong performance for these metrics.
Benchmark Thresholds for Each Metric
These benchmarks serve as a guide to assess your model’s performance and determine whether further optimization is needed. For example, AUC-ROC scores of 0.80 or above are widely regarded as strong, with scores between 0.80 and 0.90 considered “good” and anything over 0.90 viewed as excellent. Models achieving this 0.80 threshold often lead to 25%–30% higher conversion rates and can shorten sales cycles by up to 30%.
The Gini coefficient (calculated as 2×AUC – 1) offers another perspective. A Gini score above 0.60 is considered strong. For instance, in August 2025, Carson Group adopted an AI-powered lead scoring system that achieved a Gini of 0.6 (equivalent to an AUC of 0.80), enabling them to prioritize high-intent prospects and close a $68 million deal in just five weeks. Similarly, HES FinTech achieved comparable benchmarks with their predictive model, resulting in faster deal flow and improved win rates.
When it comes to precision and recall, the ideal thresholds vary by use case. A precision rate above 70%–80% ensures sales teams aren’t overwhelmed with unqualified leads. Recall becomes critical in scenarios where missing a qualified lead could have severe consequences - sales reps are three times more likely to engage when the model reliably identifies high-value prospects. A conversion lift of 25% or more compared to the baseline signals that your model is making a tangible impact.
| Metric | Strong Performance Benchmark | Why It Matters |
|---|---|---|
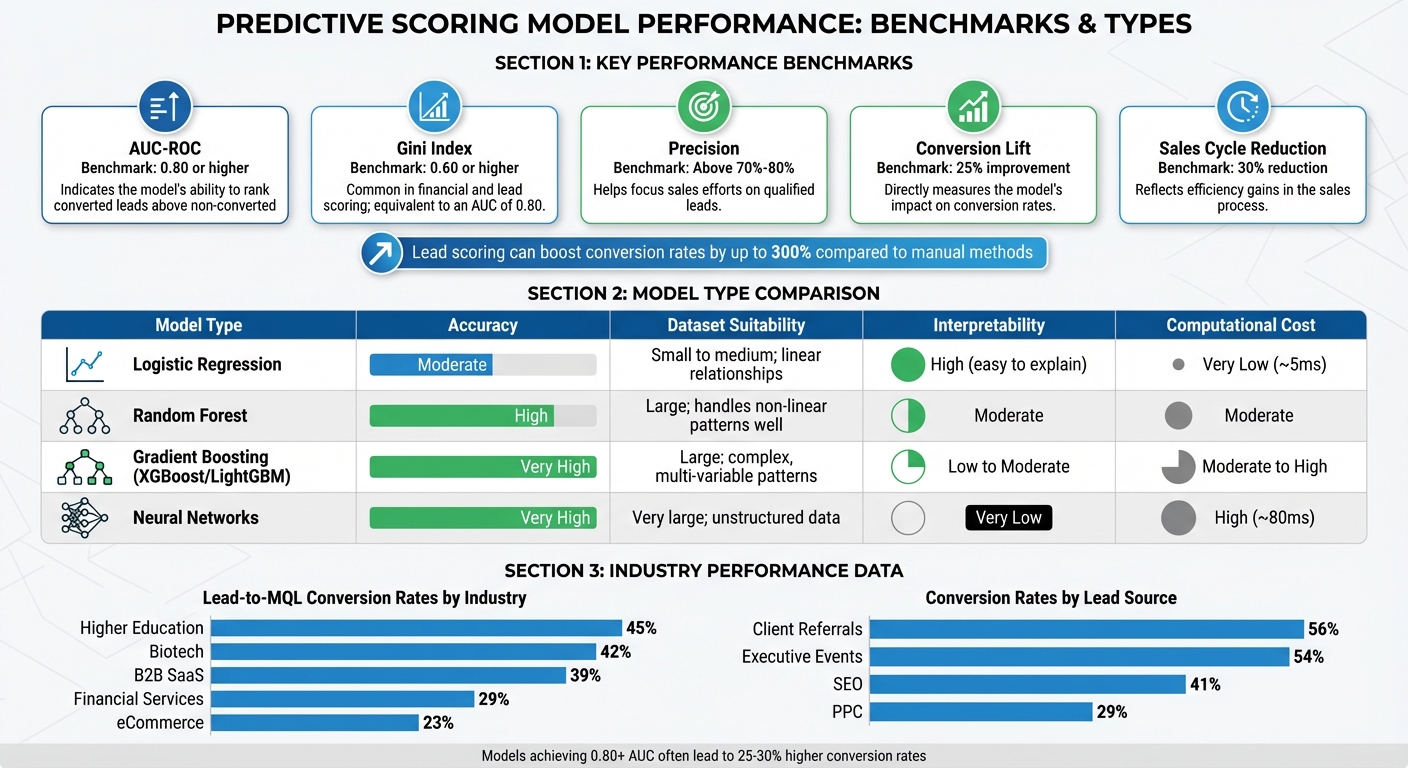
| AUC-ROC | 0.80 or higher | Indicates the model’s ability to rank converted leads above non-converted ones |
| Gini Index | 0.60 or higher | Common in financial and lead scoring; equivalent to an AUC of 0.80 |
| Precision | Above 70%–80% | Helps focus sales efforts on qualified leads |
| Conversion Lift | 25% improvement | Directly measures the model’s impact on conversion rates |
| Sales Cycle Reduction | 30% reduction | Reflects efficiency gains in the sales process |
Industry Benchmarks and Performance Data
Benchmarks by Industry
Industry-specific benchmarks highlight how lead scoring performance varies across different sectors, shaped by unique customer behaviors and sales patterns. The metrics discussed earlier adapt in distinct ways depending on the industry.
Predictive scoring models deliver different results based on factors like customer behavior, the availability of data, and the length of sales cycles. For instance, B2B SaaS companies often experience a 50% boost in sales-ready leads after adopting AI-powered scoring systems, with conversion rates increasing by 20% to 30% across most industries. The technology sector benefits from extended sales cycles and access to richer behavioral data.
In financial services, predictive models shine in tasks like credit scoring and fraud detection, enabling features like automated loan approvals and real-time fraud monitoring. Healthcare organizations use these models to cut diagnostic times from days to just minutes. Meanwhile, retail and e-commerce businesses rely on predictive analytics for dynamic pricing strategies and inventory management. Lead-to-MQL conversion rates vary widely by sector: Higher Education at 45%, Biotech at 42%, B2B SaaS at 39%, Financial Services at 29%, and eCommerce at 23%.
The source of the lead also plays a big role in performance. For example, client referrals convert at a rate of 56%, executive events at 54%, and SEO-driven leads at 41%. In contrast, PPC-generated leads convert at just 29%. Predictive models also help companies cut customer acquisition costs by as much as 60% and shorten sales cycles by 20% to 40%. Additionally, when marketing budgets focus on AI-identified revenue opportunities, ROI improves by 35%.
Case Studies: Model Optimization Results
In 2025, Carson Group, a financial services firm, implemented an AI-driven lead scoring system that allowed their sales team to focus on high-intent prospects. This approach directly contributed to securing a $68 million deal. Similarly, HES FinTech adopted a predictive lead scoring model with a Gini index of 0.6 (roughly 0.80 AUC accuracy), which led to faster deal closures and improved win rates by targeting leads with the highest likelihood of conversion. These examples illustrate that models don’t need to be perfect to deliver results - an 80% accurate model that integrates seamlessly into a CRM and gains the trust of sales teams often outperforms a 90% accurate model that operates in isolation.
Sales teams were more likely to adopt models - 92% adoption, to be precise - when the systems provided clear, actionable insights, such as identifying prospects who visited a pricing page multiple times. By tracking real-time behavioral signals, companies were able to route high-intent leads to sales reps within minutes, boosting conversion rates by 22% in just a few weeks. These case studies underscore how refining predictive models and aligning them with sales workflows can lead to substantial, measurable improvements.
Comparing Different Predictive Scoring Models
Model Type Comparison
When selecting a predictive scoring model, it's all about finding the right balance between accuracy, interpretability, and computational efficiency. Here's a breakdown of the key models and their trade-offs to help you make an informed decision.
Logistic regression is often the go-to starting point. It’s quick - delivering results in about 5 milliseconds - and straightforward, making it easy for sales teams and decision-makers to understand how different factors influence a lead's score. However, while it shines in simplicity and transparency, it can struggle to handle the complex, nonlinear relationships often seen in today’s buyer behaviors.
Random forests step up the game by handling nonlinear patterns and outliers effectively. They typically offer better predictive accuracy than logistic regression and provide some level of interpretability through feature importance rankings. This makes them a solid middle ground for teams looking for more accuracy without completely sacrificing transparency.
Gradient boosting models, like XGBoost and LightGBM, are top performers when it comes to accuracy. A 2025 study that compared 15 classification algorithms found that Gradient Boosting Classifiers excelled in B2B lead prioritization tasks. These models can boost qualified leads by as much as 40%, but they come with a trade-off: they require careful parameter tuning and operate more like a "black box", which can make it harder to explain predictions to stakeholders.
Neural networks take predictive power to the next level, especially for massive datasets with unstructured data like email sentiment analysis or social media interactions. But this comes at a cost - they're resource-intensive, taking around 80 milliseconds per prediction, and offer very limited transparency, which can be a challenge when explaining results to non-technical audiences.
The choice of model often depends on how fast you need results. For tasks like real-time email triggers or instant lead routing, a faster, simpler model like logistic regression might be the best fit. On the other hand, if accuracy is your top priority and you can afford a bit more processing time, gradient boosting or neural networks might be worth the investment. Companies leveraging machine learning for lead scoring have reported impressive results, including a 30% increase in conversion rates and a 25% reduction in sales cycles for e-commerce applications.
Here’s a summary to compare these models:
| Model Type | Accuracy | Dataset Suitability | Interpretability | Computational Cost |
|---|---|---|---|---|
| Logistic Regression | Moderate | Small to medium; linear relationships | High (easy to explain) | Very Low (~5ms) |
| Random Forest | High | Large; handles non-linear patterns well | Moderate | Moderate |
| Gradient Boosting (XGBoost/LightGBM) | Very High | Large; complex, multi-variable patterns | Low to Moderate | Moderate to High |
| Neural Networks | Very High | Very large; unstructured data | Very Low (black box) | High (~80ms) |
Starting with a simpler model like logistic regression can help you establish a baseline for your dataset’s predictive potential. From there, you can explore more advanced options like ensemble models if your data’s complexity and scale justify the additional investment.
Many organizations are now using a hybrid approach. For example, ensemble models are often deployed for internal tasks like risk ranking and lead prioritization, while logistic regression is reserved for audit-facing decisions or regulatory reporting. This strategy provides a balance between high predictive performance and the transparency needed for industries like financial services.
sbb-itb-5f36581
How to Evaluate and Optimize Your Models
Metrics to Monitor Regularly
Once your model is running, keeping tabs on its performance is crucial. Start with technical metrics like accuracy, precision, recall, F1-score, and ROC AUC. But don’t stop there - metrics tied directly to revenue tell the real story.
Take Sales Acceptance Rate (SAR), for example. This measures how often your sales team trusts and acts on the leads flagged as high-priority. A healthy SAR should hit at least 70% - if sales consistently reject "hot" leads, your model may need recalibration. Another key metric is Lead Velocity Rate (LVR), which tracks month-over-month growth in qualified leads. This shows whether your pipeline is truly expanding. Lastly, monitor the MQL-to-SQL conversion rate, which reveals how many marketing-qualified leads turn into actual sales opportunities.
Don’t overlook false positives - leads flagged as high-priority that sales teams ultimately reject. High false positive rates can frustrate your sales team and erode their confidence in the system. Similarly, pay attention to win rates by score tier. If Tier 3 leads are converting as often as Tier 1, it’s a clear sign your model needs immediate adjustment.
"The goal is not just a higher score - it is a repeatable way to turn the right signals into revenue." - The Pedowitz Group
With these metrics in place, you can focus on strategies to keep your model effective and aligned with your goals.
Strategies for Model Optimization
Models don’t stay accurate forever - buyer behavior evolves, and your model needs to keep up. Refresh your model frequently, ideally every 10 days, to maintain its relevance. Quarterly sales and marketing reviews are also essential for recalibrating your scoring system.
To prevent outdated data from skewing results, use time-based decay. For example, assign 100% weight to signals within 7 days, 50% to signals from 15–30 days, and reset scores after 60 days. This ensures your model focuses on recent buyer intent rather than stale interactions.
Another critical step is auditing your data. Remove bot-generated leads or other inaccurate data points that can throw off your model’s accuracy. Introduce negative scoring to counteract inflated scores - assign lower values to signals that suggest a lead won’t convert, such as visits to your careers page or competitor email domains. Clean data is essential; predictive lead scoring can boost SQL-to-opportunity conversion rates by 20%, but only if the data is reliable.
Establish formal feedback loops with your sales team. Let reps flag leads that scored high but weren’t actually ready to buy. This qualitative feedback can reveal gaps in your model, like missing key contextual signals. Companies that prioritize collaboration between sales and marketing see dramatic improvements, with conversion rates up to 300% higher when lead scoring is done right.
Finally, implement a tiered follow-up system. Route Tier 1 leads to sales within 24 hours, while Tier 3 leads go into automated nurture campaigns. This approach ensures high-priority leads get immediate attention, while lower-priority ones are guided along until they’re ready. With B2B conversion rates typically around 3–5%, this kind of precision is vital for making the most of your resources.
Conclusion and Key Takeaways
Performance Benchmarks Summary
When it comes to predictive scoring, the numbers speak for themselves. Lead scoring can boost conversion rates by as much as 300% compared to relying on guesswork alone. A competitive model often achieves an AUC (Area Under the Curve) of 0.80 or higher, far surpassing traditional rule-based systems, which usually cap out at 60–65% effectiveness. But remember, practical application often matters more than just theoretical accuracy.
Key performance indicators to keep an eye on include MQL-to-SQL conversion rates and false positive rates - the percentage of high-scoring leads that sales ultimately reject. Benchmarks vary by industry: for example, B2B SaaS averages a 39% lead-to-MQL conversion rate, while Solar Energy reaches 45%. Beyond these metrics, predictive scoring can make a tangible difference in day-to-day operations, enabling sales reps to increase their daily contact rate by 30% and reducing time wasted on unqualified leads by up to 40%.
These benchmarks lay the groundwork for taking your lead scoring process to the next level.
Next Steps for Your Lead Scoring
Now that you have a clear picture of performance benchmarks, it’s time to refine your lead scoring system. Start by auditing your current model against these standards. If your false positive rate is creeping up or sales teams are ignoring your scores, it’s a sign that recalibration is overdue. Consider implementing time-based decay to prevent outdated scores from skewing results, and schedule quarterly reviews with sales and marketing teams to keep the system aligned with real-world outcomes. Establishing feedback loops is critical for ensuring your model evolves with the data it collects - after all, around 79% of generated leads fail to convert.
The foundation of any successful predictive model is clean, high-quality data. To maintain performance, weed out bot submissions, eliminate duplicates, and train your model using a balanced dataset - aim for at least 40 qualified and 40 disqualified leads. If you’re capturing leads through forms, platforms like Reform can simplify the process with features like email validation, spam prevention, and lead enrichment, ensuring your data is accurate from the start.
Finally, make sure your scores are integrated into real-time workflows. With the global lead scoring software market projected to hit $1.4 billion by 2026, automation is key. Set up automatic routing for Tier 1 leads, define clear service-level agreements (SLAs) for follow-up times, and ensure your sales teams understand not just the scores but the logic behind them. With solid benchmarks, continuous refinement, and clean data, you’ll set the stage for lead scoring that doesn’t just generate numbers - it generates revenue.
How Do Predictive Lead Scoring Models Work? - Sales Saas Breakdown
FAQs
What metrics are most important for evaluating the performance of predictive scoring models?
When assessing predictive scoring models, there are a few key metrics that can give you a clear picture of how well the model performs:
- Accuracy: This tells you how often the model gets it right overall. It's a straightforward way to measure its general effectiveness.
- Recall: This focuses on the model's ability to catch true positives. It's particularly important in scenarios where overlooking critical leads or outcomes could have serious repercussions.
- Root Mean Square Error (RMSE): If you're working with regression-based models, RMSE measures the average gap between predicted and actual values. It’s a handy way to evaluate how precise those predictions are.
By focusing on these metrics, you can better understand a model's performance and ensure it meets the needs of various industries and applications.
How do industry benchmarks influence the success of predictive scoring models?
Industry benchmarks offer a useful way to gauge how well predictive lead-scoring models are performing by comparing your outcomes to others in the same field. For example, AI-powered scoring has been shown to improve lead-generation ROI by 70%. However, results can differ across industries - retail and SaaS businesses often see 15–20% increases in conversion rates, while B2B services tend to achieve improvements closer to 25%. By comparing your performance to these figures, you can identify areas where tweaks might be needed, like fine-tuning score thresholds or improving the quality of data inputs.
Benchmarks also help set realistic expectations around cost efficiency. Companies leveraging predictive scoring frequently see up to a 75% boost in lead conversions and an average ROI of 138%, compared to just 78% ROI for those not using such models. Falling below these numbers might signal issues like unreliable data or outdated algorithms. Tools like Reform, which offers features such as multi-step forms, conditional routing, and real-time analytics, can assist in gathering cleaner, more actionable data. This, in turn, helps refine scoring models and exceed industry norms.
In essence, industry benchmarks serve as a guide for ongoing improvement, ensuring that predictive scoring continues to drive tangible gains in both conversion rates and revenue.
How can predictive scoring models be improved over time?
To get the most out of predictive scoring models, start by ensuring your data is top-notch. A well-maintained dataset - clean, enriched, and comprehensive - lays the groundwork for effective model training. Once your model is up and running, keep an eye on key metrics like accuracy, lift, or mean-squared error. These indicators will tell you when the model might need adjustments or retraining.
You can boost performance by fine-tuning features, tweaking model parameters, and customizing scores to align with specific stages in your sales process. It’s also smart to benchmark any updates against earlier versions to confirm you're seeing real improvements. Don’t forget to incorporate feedback: compare high-scoring leads with actual results, and adjust thresholds or features as your business priorities shift.
Staying on top of market dynamics is crucial. Leverage tools like real-time analytics and data enrichment platforms such as Reform to keep your model in sync with changing trends and goals. Regular reviews - whether monthly or quarterly - are a great way to make sure your model stays accurate and continues delivering real value.
Related Blog Posts
Get new content delivered straight to your inbox

The Response
Updates on the Reform platform, insights on optimizing conversion rates, and tips to craft forms that convert.


Drive real results with form optimizations
Tested across hundreds of experiments, our strategies deliver a 215% lift in qualified leads for B2B and SaaS companies.
