
.webp)
How Cookie Consent Impacts E-Commerce Conversions


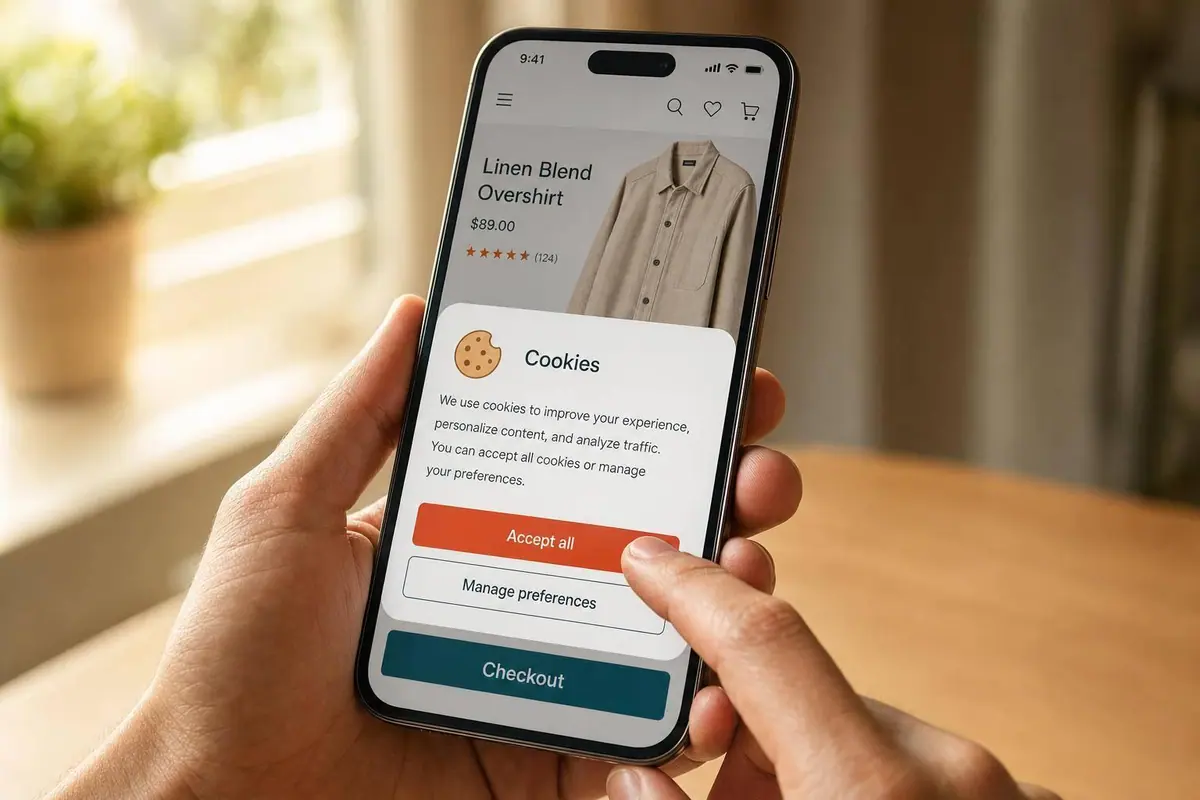
Cookie banners can hurt sales, hide sales from analytics, or do both at the same time.
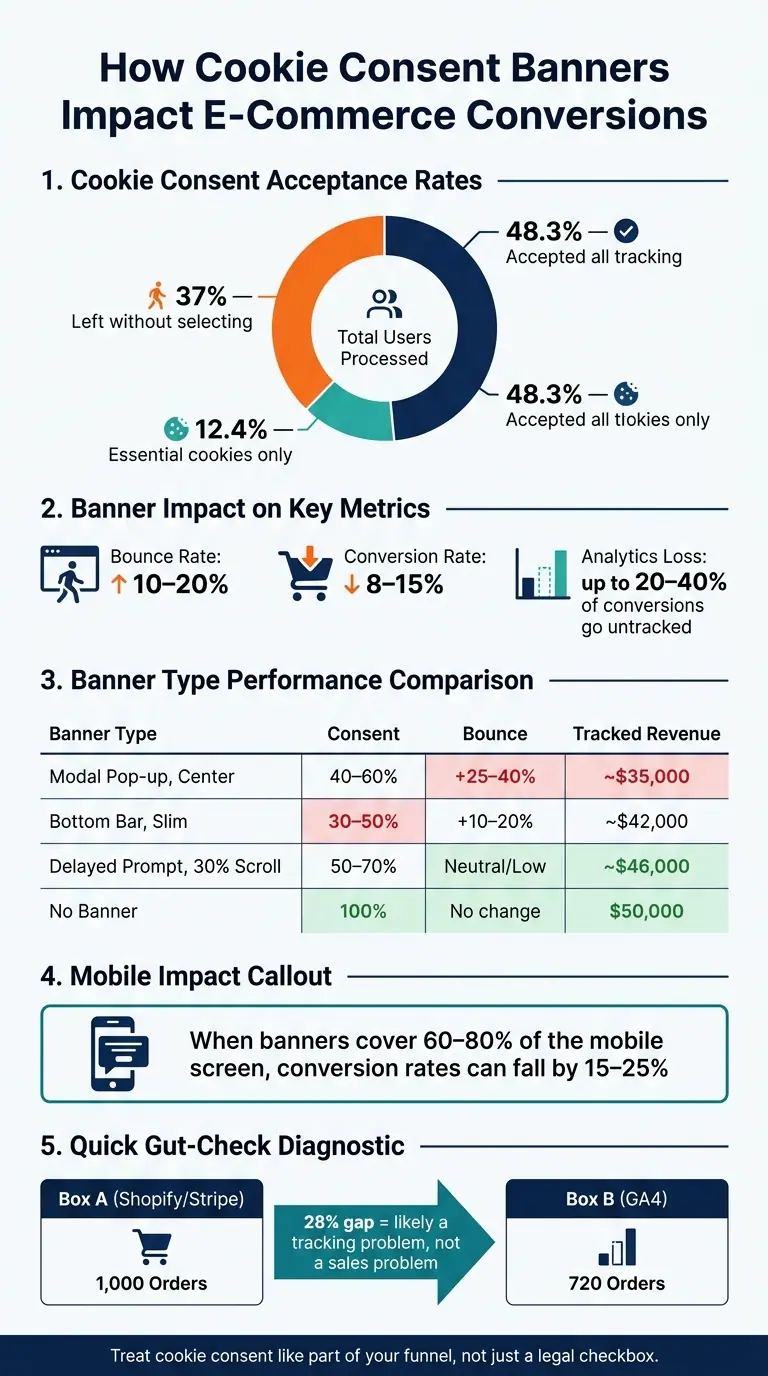
If you run an online store, here’s the short version: many sites see cookie acceptance rates between 30% and 70%, bounce rates go up by 10% to 20%, and conversion rates can drop by 8% to 15% after adding a banner. On mobile, the hit can be worse when the banner blocks product content. At the same time, stores can lose 20% to 40% of reported conversions in tools like GA4 even when orders still go through.
So I’d look at this issue in two parts:
- Behavior change: shoppers leave, stop browsing, or abandon checkout because the banner gets in the way
- Tracking loss: orders happen, but analytics tools miss them when users say no to non-required cookies
- Design effect: full-screen modals tend to do more damage than slim bottom bars or delayed prompts
- Rule differences: EU rules often lead to more data loss than California rules because EU consent usually needs opt-in first
- What to test: consent rate, bounce rate, add-to-cart rate, checkout completion, page speed, and backend orders vs. GA4
A simple check helps fast: if your store backend shows 1,000 orders but GA4 shows 720, you may have a tracking problem more than a sales problem. But if bounce rate jumps and add-to-cart falls at the same time, the banner may be hurting the shopping flow too.
| Area | What usually happens |
|---|---|
| Consent rate | Often 30% to 70% |
| Bounce rate | Often up 10% to 20% |
| Conversion rate | Often down 8% to 15% |
| Mobile impact | Worse when banners cover 60% to 80% of the screen |
| Analytics loss | Up to 20% to 40% of conversions may go untracked |
| Best gut check | Compare Shopify/Stripe orders with GA4 |
The main point: if you want clean reporting and fewer lost sales, treat cookie consent like part of your funnel, not just a legal box to check.
How Cookie Consent Banners Impact E-Commerce Conversions
What the Data Shows About Conversion Rates
Consent Rates, Bounce Rates, and Checkout Completion
Across studies, cookie acceptance rates usually land between 30% and 70%. At the same time, banners often push bounce rates up and checkout completion down, especially on mobile.
One 2026 study puts some hard numbers behind that:
- 48.3% of users accepted all tracking
- 12.4% chose essential cookies only
- 37% left without making any selection
That matters because even a small interruption can change how people move through a store. On sites with cookie banners, bounce rates tend to climb by 10% to 20% on average. If the banner takes over the screen, that jump can hit 25% to 40%.
For mid-market e-commerce stores, the average bounce-rate increase sits around 12% to 18%, while conversion tends to drop by 8% to 15%. On mobile, the hit can be worse. When a banner covers 60% to 80% of the viewport and blocks product images or the "Add to Cart" button, mobile conversion rates can fall by 15% to 25%.
The big issue here is simple: is the banner changing what shoppers do, or just changing what your analytics tools can see?
When Lower Reported Conversions Are Mostly a Measurement Problem
This is where a lot of stores get tripped up.
A drop in reported conversions does not always mean a drop in sales. The cleanest way to check is to compare backend orders in Shopify, Stripe, or your CRM against GA4 or ad-platform reports over the same 30-day window. If the gap is large, the cause is often consent-related tracking loss, not lost revenue.
Here’s a plain example. If Shopify shows 1,000 orders and GA4 shows 720, that 28% gap is often tied to the share of visitors who refused consent.
When shopper behavior is changing for real, you usually see it in the early signals first, like higher bounce rates and fewer add-to-cart actions. That’s the giveaway. Reducing friction is key; for example, breaking long forms into steps can significantly recover lost engagement.
Banner Type vs. Measured Outcomes: Comparison Table
The type of banner you use shapes two things at once: what your analytics platform can record and whether people stick around long enough to buy. The table below compares common banner patterns using a store with $50,000 in actual monthly revenue as the baseline.
| Banner Type | Consent Rate | Bounce Rate Impact | Checkout Completion | Tracked Revenue |
|---|---|---|---|---|
| Modal Pop-up (Center) | 40–60% | +25–40% | −3.5% | ~$35,000 |
| Bottom Bar (Slim) | 30–50% | +10–20% | −1.2% | ~$42,000 |
| Delayed Prompt (30% Scroll) | 50–70% | Neutral/Low | −0.5% | ~$46,000 |
| No banner | 100% (N/A) | No change | No change | $50,000 (full visibility) |
That comparison shows why two stores can have the same sales but very different reported results. In some cases, the banner hurts the user experience. In others, it mainly cuts into tracking. Often, it does both.
The next variable is design: form layout and friction can shift these numbers even when the banner type stays the same.
sbb-itb-5f36581
How Banner Design Affects Trust and User Decisions
Design Elements That Increase or Reduce Friction
Banner type matters, but the smaller design choices often shape the user's reaction. A prompt can feel like a normal site setting, or it can feel like a roadblock, much like how multi-step forms beat static ones by reducing initial friction.
Full-screen modals are a good example. When they block scrolling or clicking before people even see what the page offers, bounce rates climb by 25% to 40%. On the other hand, non-blocking banners tend to do less damage. Footer bars and lower-right desktop placement keep more traffic in place and often lead to more acceptances, with bottom-right placement reaching acceptance rates of about 34%.
Button design matters too. When "Accept" and "Reject" have the same size, color, and visual weight, people are less likely to leave the page. That balance signals a fair choice instead of a shove.
Copy plays a big role as well. Vague lines like "To improve your experience" can make people pause because they don't say much. More specific wording, like "Remembering basket contents," gives a clear reason and feels easier to trust. Short, plain language paired with styling that matches the site helps the banner feel expected instead of annoying.
Dark Patterns, Default Bias, and Consent Fatigue
Some banner designs don't just guide users. They push them.
When "Accept" stands out and "Reject" is buried two clicks deep, engaged-session rate drops by 12 to 18 percentage points. That's not a small shift. It suggests users notice when the choice is slanted, even if they still click through.
Under GDPR, pre-ticked boxes for marketing or analytics do not count as valid consent. That rule exists for a reason: defaults shape behavior. If the choice is made in advance, many people won't stop to change it.
Then there's repetition. Repeated prompts can wear people down, leading to consent fatigue. In the short term, that can push acceptance rates up, affecting as many as 80% of users who eventually give consent. But a worn-down "yes" doesn't do much for trust.
The money side is hard to ignore. In January 2022, France's data protection authority, CNIL, fined Google €150 million and Facebook €60 million for failing to offer an equivalent "Reject All" button. Cases like that show how design choices can move from UX issue to legal problem fast.
Trust-Oriented Design vs. Manipulative Design: Comparison Table
The gap between a banner that builds trust and one that chips away at it often comes down to a few plain design choices. Here's how those choices line up with user behavior.
| Design Attribute | Trust-Oriented Design | Manipulative Design (Dark Pattern) |
|---|---|---|
| Button Prominence | Equal size, color, and weight for Accept/Reject | "Accept" highlighted; "Reject" grayed out or hidden |
| Reject Path Depth | 1-click "Reject All" available on the first layer | Reject buried 2+ clicks deep via "Manage Preferences" |
| Timing | Non-blocking; content visible before prompt | Immediate full-screen modal blocking all interaction |
| Default State | All non-essential categories unchecked | Pre-ticked checkboxes for marketing/analytics |
| Language | Specific, plain-language descriptions | Vague legal jargon or urgency-driven wording |
| Effect on Trust | Higher trust and repeat visits | Lower trust and greater compliance risk |
The next section covers what regulations require and how those rules affect tracking.
Regulations, Analytics Limits, and Optimization Tradeoffs
What Regulations Require and Why It Matters for Stores
Rules change by market, and that changes both how a consent banner works and what a store can measure.
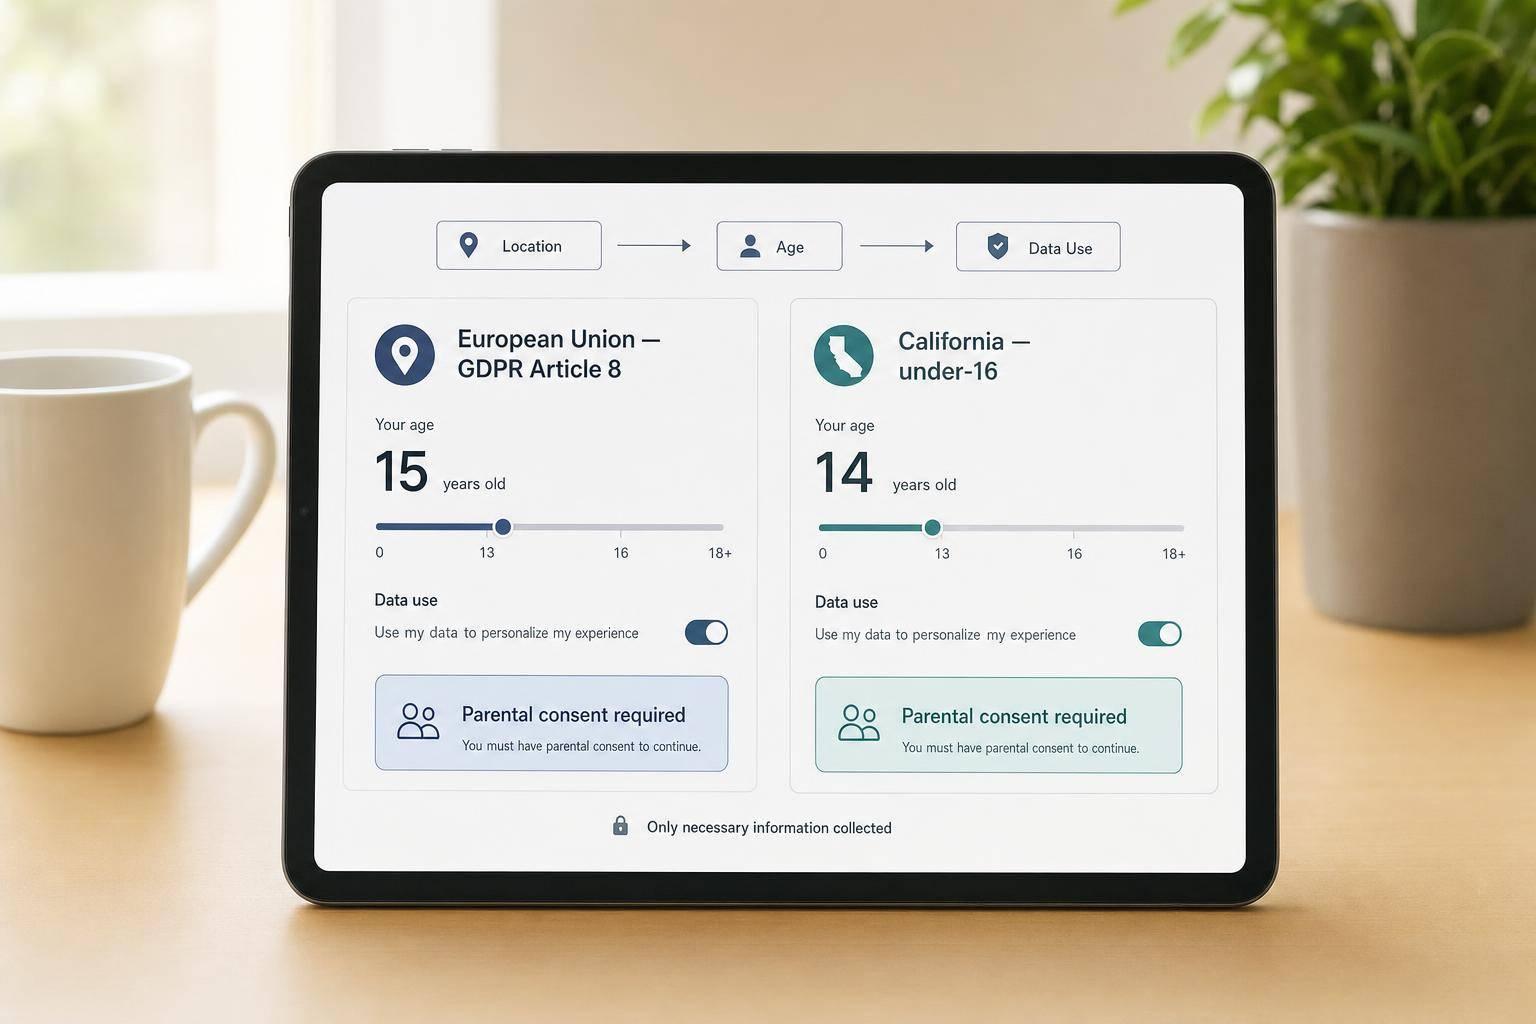
Under GDPR and the ePrivacy Directive, non-essential cookies must wait until a user gives opt-in consent. Stores also can't block checkout just because someone refuses optional cookies.
California's CCPA/CPRA takes a different path. It's an opt-out model, which means cookies can run by default as long as users get a clear way to stop their data from being sold or shared. In most cases, that means a "Do Not Sell or Share My Personal Information" link.
That difference hits more than legal teams. It shapes conversion performance too. A banner that cuts tracking can also cut what your team sees in analytics.
The risk isn't theoretical. In June 2023, ad-tech firm Criteo was fined €40 million for tracking users without valid consent. Then on March 6, 2024, Google Consent Mode v2 became mandatory for advertisers operating in the EEA, UK, and Switzerland.
Essential Cookies vs. Analytics and Marketing Cookies
When non-essential cookies stay off, the big problem usually isn't checkout. It's lost reporting.
Strictly necessary cookies do not need consent under GDPR or ePrivacy. So if a shopper declines every optional cookie, they can still browse the site, add products to the cart, and finish a purchase without any functional break. The store still works. What disappears is visibility.
Once a user declines analytics and marketing cookies, those tools stop collecting data from that session entirely. Consent Mode v2 Advanced Mode can bring back modeled aggregate conversions, but not user-level data. It restores estimates, not user-level data, while keeping aggregate reporting and bidding signals in place.
That tradeoff matters. You may still see top-line numbers, but the person-by-person trail is gone.
EU vs. California Requirements and Measurement Impact: Comparison Table
The table below shows how the two systems differ in consent model and measurement impact.
| Feature | EU (GDPR / ePrivacy) | California (CCPA / CPRA) |
|---|---|---|
| Consent Model | Strict opt-in; consent required before non-essential cookies fire | Opt-out; cookies run by default unless the user opts out |
| Dark Pattern Rules | High scrutiny; "Reject All" must be as easy to access as "Accept All" | Bans deceptive designs that subvert user choice |
| Common Banner Setup | Interruptive modal or layered banner is common | Simple footer link or non-blocking notice often suffices |
| Reporting Visibility | High data loss; rejection rates commonly range from 40% to 60% | Lower data loss; most users do not actively opt out |
| Measurement Impact | Heavy reliance on modeled data and aggregate signals | Greater reliance on observed first-party data |
Track Ecommerce with Enhanced Conversions & Consent Mode (GA4 & Google Ads)
Ways to Cut Conversion Friction, Backed by Research
After the compliance tradeoffs, the next thing that shapes results is design.
Banner Changes That Studies Consistently Support
Less interruption usually means fewer people leave. Research links a slim bottom-strip banner, about 60 px tall, with lower bounce rates than center-screen modals or full-screen overlays that block product images or the "Add to Cart" button.
Timing also plays a big part. Showing the banner only after a visitor has scrolled at least 30% of the page can reduce abandonment, because people who have already started engaging with the page are less likely to bail when the prompt appears. On mobile, the banner shouldn't cover more than 30% of the screen.
Copy matters too. Keep it plain and specific, and explain the purpose in a single sentence. The way choices are presented matters just as much: a clear Accept/Reject option creates less friction, while multi-step category dialogs add extra work and can increase bounce risk.
Transparent, low-friction consent design can support both trust and completion.
Metrics to Track During Consent Banner Tests
Once the banner is simpler, the next step is to see whether that change helps both user behavior and data quality.
Track:
- consent rate
- bounce rate
- add-to-cart rate
- checkout completion
- backend-vs-GA4 gaps
Running a cookieless analytics tool alongside your main setup for two to four weeks can help you set a baseline for actual traffic versus consented traffic. Use consent-mode reporting as a supplement, not a stand-in, for backend order data.
Performance needs attention too. Every 100 ms of CMP delay can reduce conversions by about 1%. Track Core Web Vitals next to consent metrics so you can spot regressions early.
Conclusion: The Most Reliable Findings Across Studies
The practical takeaway is simple: consent UX affects both revenue and reporting. Treat it like any other step in the funnel, and use backend data as your source of truth.
FAQs
How do I tell if cookie consent is hurting sales or just tracking?
Compare backend order counts with your analytics reports. If orders in your store or CRM stay steady but reported conversions drop, that usually points to a tracking gap, not a sales issue.
Why? When people decline consent, tracking pixels may never fire. So the sale still happens, but your reports miss it.
To check whether that’s what’s going on, look at a few things:
- Your consent acceptance rate
- Heatmaps that show whether the banner is getting in the way
- Mobile vs. desktop performance
If the drop shows up mostly on mobile, that’s a strong sign of banner friction, not weaker shopper demand.
What cookie banner design hurts conversions the least?
A bottom-pinned bar usually does less damage to conversions than a full-screen modal. Full-screen banners can push bounce rates up by 25% to 40%, while a bottom bar feels less intrusive and keeps the page usable.
For a better user experience, use clear, plain language. Make the Accept and Reject buttons equally visible, and make sure the banner loads fast.
Do I need different consent setups for U.S. and EU visitors?
Yes. Requirements vary by jurisdiction.
The EU usually follows an opt-in model. That means you need clear, explicit consent before placing non-essential cookies.
The U.S. usually takes an opt-out approach under state laws. In plain English: businesses are expected to give clear disclosures and offer a way for people to opt out of data sharing.
To help with both compliance and conversions, use a consent management platform that adjusts banner behavior based on the user's location.
Related Blog Posts
Get new content delivered straight to your inbox

The Response
Updates on the Reform platform, insights on optimizing conversion rates, and tips to craft forms that convert.

Drive real results with form optimizations
Tested across hundreds of experiments, our strategies deliver a 215% lift in qualified leads for B2B and SaaS companies.
