
.webp)
Intent Data for Predictive Lead Scoring Models


Intent data helps you spot timing, not just fit. If I had to boil this article down to one point, it’s this: the best lead scoring models do not treat intent as a standalone score. They combine fit, behavior, and intent, then test whether those signals lead to pipeline and closed deals.
Here’s the short version:
- High-intent actions like high-converting lead forms like demo requests, pricing page visits, and trial starts, competitor comparison views, and review-site activity tend to matter more than blog reads or email opens.
- Recency and velocity matter a lot. Three visits in 48 hours can mean more than 15 visits over six months.
- Account-level activity is stronger than one-person activity. If several contacts from one company engage within 10 days, that’s a stronger sign.
- First-party data usually carries more weight than third-party intent because it shows direct interest in your product.
- Behavior and intent should decay over time. Many models cut scores after 14–30 days of inactivity and reset after 60 days.
- Validation is the whole game. Look at 12–18 months of pipeline and closed-won data, use a 10% holdout group, and check if “Hot” leads convert better than “Warm” or “Nurture.”
- The article cites that 67% of the B2B buying journey happens before vendor contact, and teams using intent data report 2x higher conversion rates on targeted accounts.
What I like here is the simple rule behind it: fit tells you who, intent tells you when, and behavior tells you what they’re doing with you. That makes scoring easier to read, easier to route, and less likely to overrate noisy activity.
A few takeaways stand out:
- Keep fit stable and separate
- Let behavior and intent change with time
- Weight actions from conversion history, not guesswork
- Watch sales rejection rates and recalibrate if “Hot” leads are getting pushed back
- Review the model every 90 days, not every month
If you want a scoring model that sales will use, this article makes the case for one thing: show the top signals behind the score, and prove that the score leads to pipeline.
Actioning Intent Data: Step-by-step Strategies for Lead Generation Success in 2025
sbb-itb-5f36581
Research Findings: Which Intent Signals Carry the Most Predictive Weight
Predictive scoring should weight signal quality, not just activity volume. The strongest predictors usually aren't the noisiest behaviors. They're the actions that point to evaluation, urgency, and forward movement.
High-Intent Actions vs. Low-Signal Activity
The clearest split is between evaluation-stage actions and low-signal activity. Active signals - demo requests, pricing page visits, trial starts, and integration or API doc views - show that a buyer is in the evaluation or decision stage. Passive signals like blog reads and email opens point more to awareness, but on their own they carry little urgency.
The pattern matters too. A path from a blog post → case study → API docs → demo request lines up closely with a buying journey. Optimizing these touchpoints can significantly increase qualified leads. That kind of progression is far more predictive than a big pile of activity that never gets to a product or pricing page.
At the account level, intent often shows up across more than one contact. That's why account-level aggregation and lead qualification matter. Engagement from multiple contacts at the same company often predicts conversion better than activity from just one person.
How Recency, Frequency, and Context Affect Signal Quality
Even a strong signal fades fast. Good models use score decay logic, often cutting behavioral scores after 14–30 days of inactivity and resetting them after 60 days with no activity.
Recency isn't the only thing that matters. Velocity often beats volume. Three sessions within 48 hours carries much more predictive weight than 15 sessions spread across six months. And when several people from the same account engage in the same time frame, the signal gets stronger. Three stakeholders from one company viewing pricing and competitor comparison content within a 10-day window is a high-confidence buying signal - much stronger than one contact doing the same.
Context shapes signal weight too. A return visit that moves from a blog post to a pricing page should score higher than another view of the same page. Why? Because movement toward higher-intent pages mirrors a logical buying path.
That brings up the next issue: data quality. Which sources make these signals dependable enough to score?
Data Sources That Improve Predictive Score Accuracy
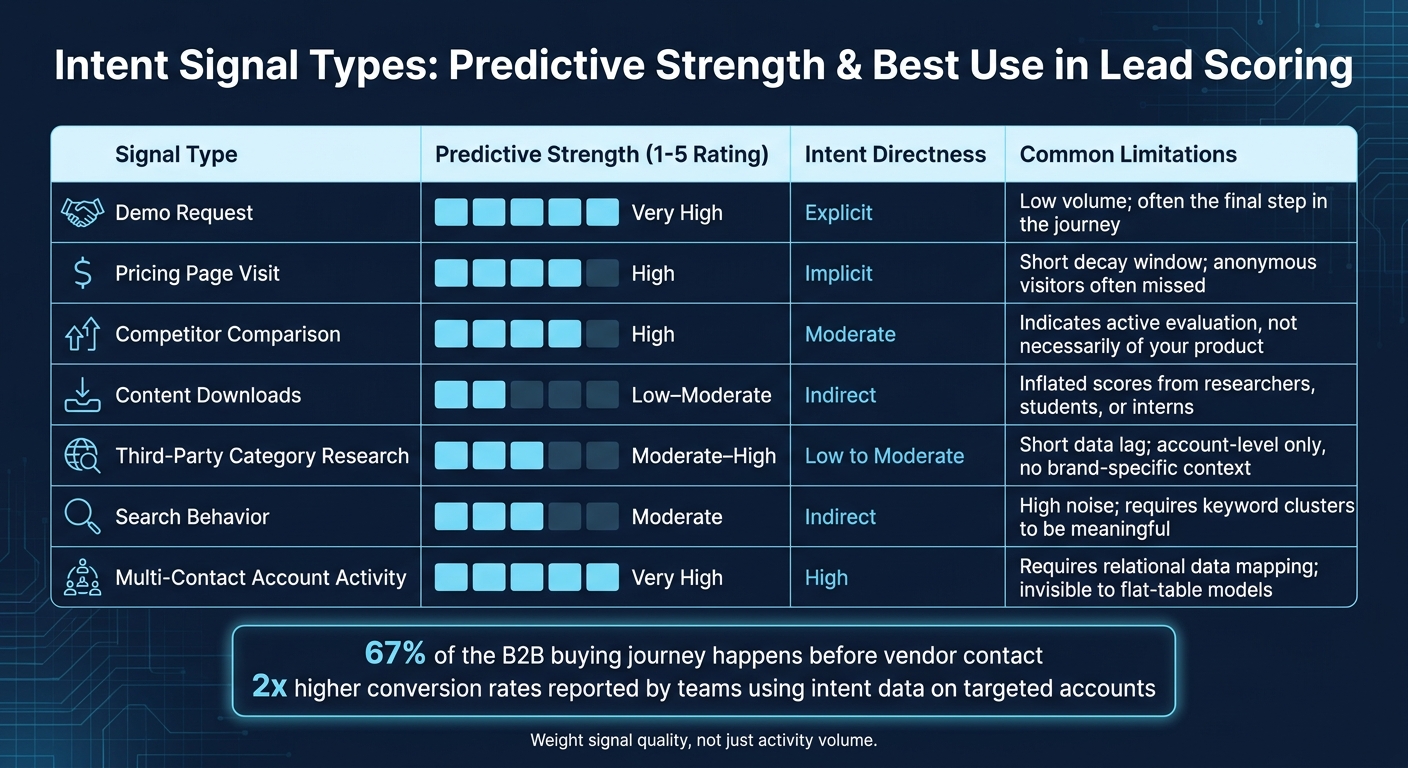
Intent Signal Types: Predictive Strength & Best Use in Lead Scoring
Not every data source should shape a scoring model the same way. Some signals point to direct product evaluation. Others only hint that someone is doing category research. That gap matters because source quality affects signal weight.
| Signal Type | Predictive Strength | Intent Directness | Common Limitations |
|---|---|---|---|
| Demo Request | Very High | Explicit | Low volume; often the final step in the journey |
| Pricing Page Visit | High | Implicit | Short decay window; anonymous visitors often missed |
| Competitor Comparison | High | Moderate | Indicates active evaluation, not necessarily of your product |
| Content Downloads | Low–Moderate | Indirect | Inflated scores from researchers, students, or interns |
| Third-Party Category Research | Moderate–High | Low to Moderate | Short data lag; account-level only, no brand-specific context |
| Search Behavior | Moderate | Indirect | High noise; requires keyword clusters to be meaningful |
| Multi-Contact Account Activity | Very High | High | Requires relational data mapping; invisible to flat-table models |
The table gives you the pecking order. The sections below show how to use it in practice.
First-Party Behavior and Form Data
First-party data is usually the strongest signal in a scoring model because it shows direct engagement with your brand, not just general interest in the space. Search behavior and content downloads become much more useful when they bunch up around product, pricing, or comparison themes.
Form submissions sit at the top of the first-party stack because they show explicit intent. A buyer is choosing to hand over information. That said, form data is only as good as the system behind it. Tools like Reform help improve data quality with conditional routing, lead enrichment, email validation, and spam prevention.
Third-Party Intent, CRM History, and Enrichment Data
Use third-party intent to spot accounts. Use CRM history and enrichment to score them with more precision.
Third-party intent can surface account-level research before a buyer ever lands on your site. That makes it useful for finding unknown in-market accounts. But it does not include your brand-specific context, so it works best for top-of-funnel discovery, not for assuming a lead is ready to buy.
Historical closed-won and closed-lost records are a core input for training a model to spot patterns tied to revenue, not just activity. When you combine outcome history with firmographic and intent data, predictions get better because the model is grounded in what has converted before.
Enrichment data helps fill in the blanks. Adding firmographic fields like company size, industry, and revenue, along with technographic data like current tech stack, can reduce fuzzy mid-range scores caused by incomplete CRM records. Predictive models tend to work best when the fields they score are already populated and dependable.
Next, separate fit, behavior, and intent so noisy inputs do not overpower clean ones.
Model Design: Keep Fit, Behavior, and Intent Separate
When you blend fit, behavior, and intent into one score, the result gets murky fast. It becomes hard to see why a lead scored well and even harder to decide what should happen next. Keeping these three signals separate makes scoring easier to read, easier to weight, and easier to route. It also helps intent do its job: guide timing and routing without drowning out fit or behavior.
| Dimension | What It Measures | Key Inputs | Why Keep It Separate? |
|---|---|---|---|
| Fit | Whether a company matches your ICP | Industry, company size, revenue, tech stack, job title | Acts as a hard filter; prevents high-activity but wrong-fit leads from reaching sales |
| Behavior | Active interest in your specific solution | Pricing page visits, demo requests, email clicks, product usage | Allows time-based decay; shows where a prospect sits in your funnel |
| Intent | External research in the category | Category search spikes, competitor comparisons, content downloads, review site visits | Identifies active buying windows before a prospect ever lands on your site |
The examples below show how each signal fits into the right bucket.
What Belongs in Each Scoring Dimension
Fit covers firmographic and technographic data: company size, industry, revenue range, tech stack, and the job title of the person engaging. These signals tell you whether the account can buy. They also tend to stay stable, since firmographic traits don’t change often.
Behavior is on-site engagement. Intent is off-site category research.
Behavior tracks what a prospect does on properties you control, like product page visits, email clicks, webinar attendance, and trial usage. Capturing these signals often starts with multi-step form design to gather data without increasing friction. Intent tracks activity outside your site, like category search spikes, competitor comparisons, content downloads, and review site visits.
That split matters in practice. A high-fit, low-intent lead should usually stay in nurture. A low-fit, high-intent account may be worth fast qualification, but not an automatic handoff.
How to Weight Actions Without Overvaluing Noisy Activity
Action weights should come from historical conversion data, not gut feel. Demo requests and trial requests should carry the most weight. Pricing page visits should sit in the middle. Blog views should get very little weight.
A few guardrails help keep the model clean:
- Cap repeated low-intent actions so one person refreshing a blog post doesn’t look sales-ready
- Decay behavioral scores after 15–30 days of inactivity
- Apply decay to behavior and intent, but not to fit
Fit is mostly stable. Behavior and intent change with time. If you treat all three the same way, the score starts lying to you.
Those weights should then be checked against conversion outcomes in the next step.
Validation: How to Measure Whether Intent Data Improves the Model
How to Test Whether Intent Data Adds Predictive Lift
Once the model is weighted, the next step is simple: check whether intent predicts pipeline, not just surface-level activity.
The best way to validate intent data is to line it up against what happened in your pipeline. Pull 12–18 months of closed-won deals and look at their intent scores 30, 60, and 90 days before close. That gives you a data-backed baseline for what high intent looks like in your market.
After that, run the cleanest test you can: a holdout group. Set aside about 10% of your top-scoring accounts and keep them out of sales routing. Then compare conversion rates between the routed group and the holdout group. That gap is your incremental lift, and it’s the only reliable way to show stakeholders that intent data is adding something new.
Score band calibration is also worth checking. If your "Hot" tier converts at about the same rate as "Warm" or "Nurture," your weighting is off and needs recalibration. Put bluntly, if all three buckets behave the same, the labels aren’t doing much.
Use 90-day review cycles instead of monthly check-ins. Monthly snapshots are usually too thin to show useful B2B patterns. In each review, compare actual conversion rates with what the model predicted. If the gap is more than 20 percentage points, retrain the model or retire it.
It also helps to watch sales rejection rates. If sales is rejecting more than 20% of "Hot" leads, your thresholds are probably tuned for MQL volume instead of SQL conversion.
One small move can help a lot: include the top three signals behind a high score in the handoff to sales. Reps tend to trust the score more when they can see why the account was flagged.
| Metric | Purpose | Success Indicator |
|---|---|---|
| MQL-to-SQL Rate | Measures lead quality | Higher conversion for intent-scored leads vs. fit-only |
| Pipeline Velocity | Measures sales efficiency | Faster progression through stages for high-intent accounts |
| False Positive Rate | Measures model noise | Reduction in leads that sales rejects or ignores |
| Hot-to-pipeline rate | Measures predictive lift | Percentage of "Hot" accounts that enter pipeline within 90 days |
Final Takeaways for B2B and SaaS Teams
If the test shows lift, keep the strongest signals in place and review them on a steady cadence.
Intent should carry more weight in short SMB sales cycles - about 50% to 55% - and less weight in enterprise deals with long, committee-led buying cycles, where 25% to 30% is a better range. When it’s time to recalibrate, don’t tear the whole model apart. Adjust weights in 5 to 10 percentage point steps instead.
Validation should cover closed-won, closed-lost, and pipeline-creation outcomes so drift shows up early.
Cleaner form and CRM inputs help from day one. Tools like Reform can help with lead enrichment and validation, which gives your scoring model better data to work from.
Without feedback, the model drifts. With regular feedback loops, it stays on track. Without them, accuracy can fall by 30% to 40% within six months.
FAQs
How much should intent data influence lead scoring?
Intent data should be a core part of a composite lead scoring model. But it shouldn’t stand on its own.
A good model blends intent data with firmographic fit and direct engagement signals. In many cases, intent signals make up 25% to 55% of the total score, with the exact share often tied to sales cycle length.
Here’s the basic idea: intent shows interest, firmographic fit shows whether the account matches your ideal customer, and direct engagement shows whether people are taking action. Put those together, and you get a much clearer picture than intent data can give you by itself.
It also helps to adjust the weighting over time based on actual conversion results. That step matters because it can cut down on false positives and make the model more accurate as you learn what leads to closed deals.
Which intent signals are most reliable?
The most reliable intent signals come from active, deliberate evaluation. When someone visits high-intent pages on your site, like pricing, comparison, or demo request pages, that’s one of the strongest signs of purchase interest.
Activity on review sites also carries a lot of weight. The same goes for steady research from multiple people at the same company. Those patterns usually mean the team isn’t just browsing - they’re looking into options with purpose.
Search behavior and third-party surges can help spot interest early. But they’re most useful when first-party behavior backs them up.
How do you validate an intent-based scoring model?
Validate the model with a continuous feedback loop. Compare lead scores against actual sales results on a regular basis, and review closed-won deals every quarter to check whether high-scoring leads are turning into customers.
Before you write scores to production records, test them in a staging table. Then tune the weightings based on which intent signals are giving too much or too little credit to certain behaviors. The goal is simple: separate real buying intent from research activity that looks promising but never converts.
Related Blog Posts
Get new content delivered straight to your inbox

The Response
Updates on the Reform platform, insights on optimizing conversion rates, and tips to craft forms that convert.


Drive real results with form optimizations
Tested across hundreds of experiments, our strategies deliver a 215% lift in qualified leads for B2B and SaaS companies.
