
.webp)
Deep Learning Techniques for Lead Scoring



Most teams should not start lead scoring with deep learning. I’d use it only when there’s enough clean history, a clear conversion goal, and a team that can watch model drift after launch.
Here’s the short version:
- Rule-based scoring works when I have limited history and need clear logic.
- Machine learning often fits best when CRM and marketing data are clean enough to train on.
- Deep learning makes more sense when I’m working with large datasets, event sequences, text fields, or product-usage data.
- The model output is only part of the job. I still need:
- a clear label like SQL in 30 days or paid conversion in 90 days
- strict cutoff dates to block leakage
- score tiers tied to sales actions
- tracking for precision, recall, and calibration
- Team speed still matters. One cited finding says leads contacted within 1 hour are 7x more likely to qualify, while waiting 24+ hours makes qualification 60x less likely.
A simple way to think about it: deep learning can find patterns that point systems miss, but it also brings more setup, more risk, and more upkeep. And if the data is messy, a simpler model will often do a better job.
Quick comparison
| Approach | Best when | Main plus | Main issue |
|---|---|---|---|
| Rule-based | Little history, early-stage setup | Easy to explain | Misses multi-step buying patterns |
| ML models | Clean labeled CRM data | Strong balance of use and effort | Still depends on feature quality |
| Deep learning | Large, rich datasets with sequences or text | Learns nonlinear patterns across many signals | Harder to explain, run, and check |
In this article, I’d focus on the practical side: when deep learning is worth it, which model types fit which data, how to set labels and tiers, and how to judge whether the score is helping pipeline and revenue instead of just looking good in a dashboard.
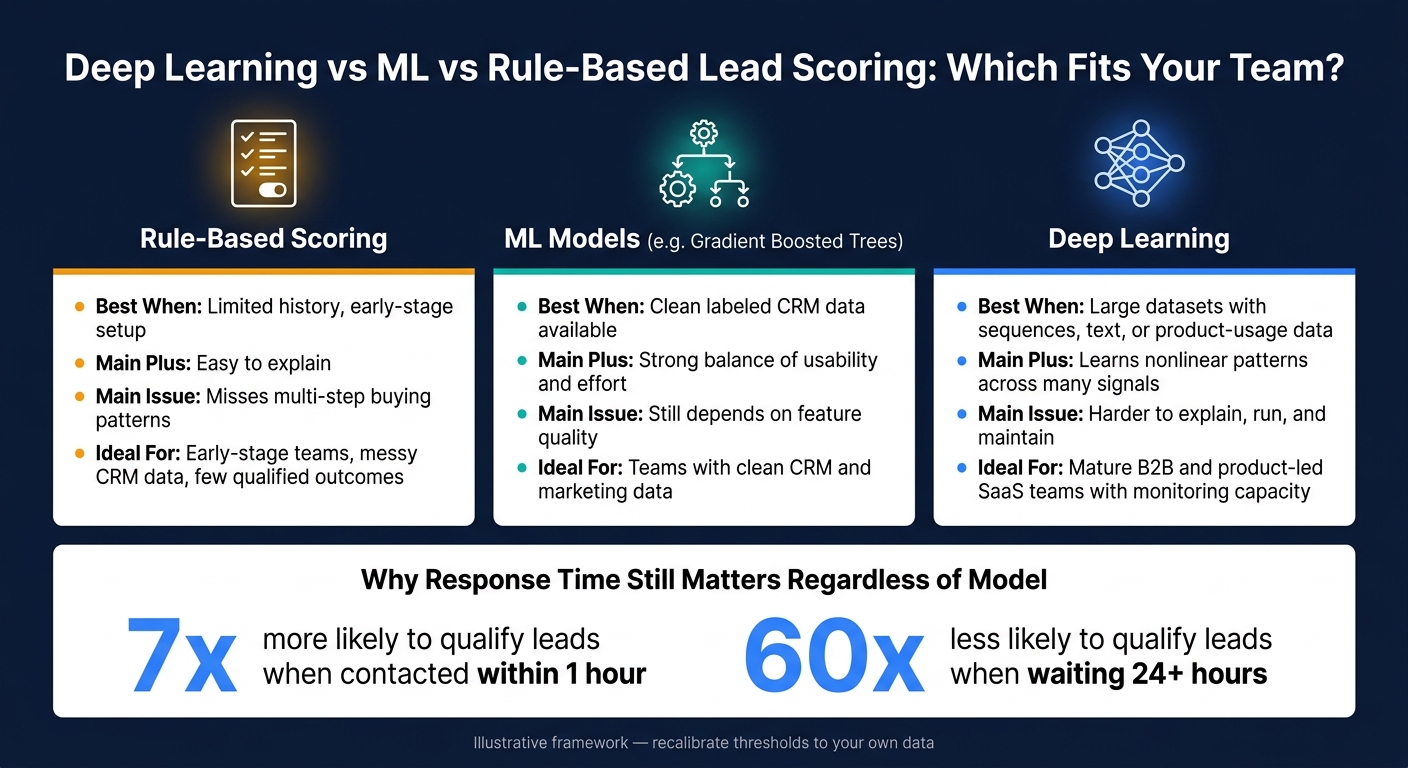
Deep Learning vs ML vs Rule-Based Lead Scoring: Which Fits Your Team?
Building an AI Lead Scoring System That Boosted Conversion by 70%
sbb-itb-5f36581
Core Neural Network Methods for Lead Scoring
Lead scoring usually comes down to three neural network patterns: feedforward models for structured data, recurrent models for event sequences, and embeddings for text-heavy or high-cardinality fields. The best fit depends on a simple question: is your lead data static, time-ordered, or packed with text?
Feedforward Neural Networks for Structured Lead Data
A feedforward neural network takes fixed inputs, passes them through hidden layers, and outputs a conversion probability. In plain English, it treats each lead as a fixed feature vector at scoring time.
That input set might include company size, industry, job-title group, acquisition source, pricing-page visits, email clicks, demo request status, number of active trial users, and days since last activity. So if you have a director-level lead at a 750-person business services company, with a demo request and active trial users, the model might score that lead at 0.68.
There’s one catch: a feedforward network doesn’t understand event order on its own. If sequence matters, you’ll need to build recency and transition features by hand or switch to a sequence model.
Recurrent Neural Networks for Time-Ordered Lead Journeys
Recurrent neural networks (RNNs) process events in sequence and carry context forward. That makes them useful when order and timing hold signals that a static summary can miss.
Take two leads with the same number of events. One goes from blog post to product page to pricing page to demo request. The other bounces around in no clear pattern. Those journeys don’t mean the same thing. The first usually shows stronger buying intent. This is why multi-step forms engagement data is so valuable for sequence modeling.
Timing adds another layer. A pricing-page visit two minutes after a demo request may signal something very different from that same visit three weeks later.
When journeys get long, teams often use LSTM or GRU models so earlier events can still matter many steps later. But there’s a tradeoff. Sequence models need clean timestamped event data, chronological training splits, and more engineering work than a feedforward baseline.
Embeddings for Job Titles, Free Text, and High-Cardinality Fields
An embedding turns a category or text value into a dense numeric vector, with similar items placed closer together in that vector space. That helps the model treat related values as related, even when the wording differs.
For example, VP of Revenue, Chief Revenue Officer, and Head of GTM can land in nearby parts of the vector space without someone manually mapping every title variant. The same idea works for free-text qualification responses in forms and CRM records. Fields like job title, industry, open-text qualification answers, and source data can share semantic overlap, which can lead to similar score contributions.
Free-text fields need care. They can contain sensitive data, so they should be cleaned before modeling. It also helps to group rare titles and industries into an "other" category to reduce overfitting. That’s where embeddings shine most: lead data with lots of title variants, open-text responses, or other fields with many possible values.
The table below shows how these three approaches compare in day-to-day lead scoring:
| Approach | Best-suited lead data | Main strength | Main limitation | Lead-scoring use |
|---|---|---|---|---|
| Feedforward neural network | Fixed structured fields and aggregated behavior | Simple deployment for CRM and marketing tables | Loses event order unless features are engineered | Score leads using firmographics, source, engagement totals, and trial metrics |
| Recurrent neural network | Time-ordered events | Captures progression, recency, and behavioral context | More complex data pipelines, validation, and explanation requirements | Predict trial conversion from ordered visits, clicks, logins, and activation events |
| Embedding-based approach | Job titles, free text, high-cardinality categories | Compresses varied values into useful numeric representations | Can overfit or encode privacy and bias risks | Map job-title variants and free-text responses to dense vectors |
What changes across these models is mostly the shape of the input. From there, the next job is to define the inputs, labels, and training setup the model will learn from.
Data Pipeline: Inputs, Labels, and Training Setup
Once you’ve picked the model architecture, the next job is more practical: decide what goes in, what outcome the model should predict, and where the cutoff sits for each training example.
Four Input Groups Drive Most Predictions
Lead-scoring models usually rely on four main input groups. Each one shows a different side of a lead: who they are, where they work, what they do, and how far they’ve gone in the buying or product journey.
| Data Group | Example Features | Predictive Value | Collection Source | Common Data-Quality Risks |
|---|---|---|---|---|
| Firmographic | Employee count, industry, annual revenue, geography, technology stack | High when the ideal customer profile is well defined | CRM, enrichment APIs, account databases | Stale company data, inconsistent industry labels, missing revenue, subsidiaries counted separately |
| Demographic | Job title, seniority, department, role, work email | Moderate to high, especially for B2B products with defined buyers | Lead forms, CRM, enrichment, email domain | Free-text title variation, personal emails, incomplete role information, duplicate contacts |
| Behavioral | Page views, content downloads, email clicks, webinar attendance, pricing-page visits | Moderate to high when events are correctly attributed and timestamped | Web analytics, marketing automation, form analytics, CRM | Bot traffic, duplicate events, cookie loss, anonymous activity not joined to a lead |
| Product or intent | Trial activation, workspace creation, integration setup, feature use, team invites, review-site activity | Often high for SaaS because it reflects actual product engagement or active research | Application database, product analytics, intent provider, CRM | Events recorded after conversion, inconsistent event names, inflated usage from internal users |
Some of these fields look simple on paper. In practice, they can get messy fast. A job title might show up as “VP Marketing,” “Vice President of Marketing,” or just “Marketing Lead.” Product events can look useful too, but not if internal testing traffic is mixed in with buyer behavior.
After inputs, the next step is setting one clear outcome the model can learn.
Label Definition, Data Prep, and Leakage Prevention
Before training starts, you need a single label and a fixed time window. Common setups include: becomes sales-qualified within 30 days, creates an opportunity within 60 days, or converts to a paid plan within 90 days. That label should come from one timestamped CRM event, with clear inclusion rules.
A good pattern is to separate the observation window from the outcome window. Say you use the first 7 days of product activity as input, then use the next 83 days as the conversion window. That structure helps block future information from slipping into the prediction.
This is where many teams get tripped up. Target leakage is one of the main reasons a model looks great in testing and then falls apart in production. It happens when a feature includes information that would not have been available at scoring time, such as opportunity stage, sales disposition, contract value, or post-conversion product usage. The fix is simple in theory and strict in practice: every training example needs a feature cutoff timestamp, and it should include only data available before that point. Imputers, scalers, and encoders should be fit on training data only, then applied to validation and test sets using those same learned transformations.
For train, validation, and test splits, a time-based split usually works better than a random one. Train on older leads, validate on a middle period, and test on the most recent period. That setup is much closer to how the model will face new leads in production. If several contacts belong to the same account, keep them grouped together so the same buying team doesn’t land in both training and test data.
How Reform Improves Lead Data Quality
Data quality starts at capture, not at model training. Reform helps clean up lead data as it comes in with email validation, spam prevention, conditional routing, lead enrichment, and real-time analytics. That means fewer invalid records, fewer incomplete submissions, and less bot-driven noise entering the scoring pipeline.
Turning Model Predictions Into Score Tiers and Sales Actions
From Conversion Probability to a Usable Lead Score
Once the model gives you a probability, the next job is simple in theory and messy in practice: turn that number into a rule your team can use.
A deep learning model outputs a predicted conversion probability. Teams might show that as a 0–100 score or as a tier label. But the score alone does not tell sales what to do next. It only starts to matter when you connect it to a routing rule.
That routing rule should look beyond model score. You also need to factor in ICP fit, territory, account ownership, open opportunities, and consent. So even if a lead scores high, it may still need to pause for review if it sits outside your target market.
Setting Hot, Warm, and Cold Score Thresholds
Avoid picking neat, round cutoffs just because they look clean. Check conversion lift and team capacity first.
Start by calculating observed conversion rates across score ranges. Then set thresholds based on what your team can actually handle. If your SDR team can responsibly work 200 prioritized leads per week, your Hot threshold should land at about that volume. And those leads should convert at a rate that is meaningfully better than your baseline.
Response time matters here too. One analysis found that companies responding to leads within one hour are 7× more likely to qualify them than companies waiting longer. It also found that organizations waiting 24 hours or more are 60× less likely to qualify a lead compared with those responding within the first hour.
| Score Band | Conversion Meaning | Routing Owner | Response Window | Automation Rule |
|---|---|---|---|---|
| 75–100: Hot | Highest predicted likelihood; validate that observed conversion rate is materially above baseline | Named SDR or AE by territory and account size | Within 1 hour | Create CRM task, notify owner, suppress generic nurture, trigger personalized outreach |
| 40–74: Warm | Moderate likelihood or promising fit, pending qualification | SDR queue or shared marketing-sales queue | Review within 1 business day | Enroll in role-specific sequence; promote to Hot if high-intent signals appear |
| 0–39: Cold | Low predicted likelihood, weak fit, or insufficient data | Marketing automation | Automated or weekly-batch follow-up | Continue educational nurture, collect more first-party data, lower outreach frequency |
Illustrative only; recalibrate to your own conversion data and capacity.
Each tier needs a clear owner, SLA, entry trigger, and exit condition. For example, a Warm lead that books a demo should move to Hot on its own. Tiers should also update as buying signals change.
From there, test those tiers against conversion lift, pipeline velocity, and sales capacity.
Evaluation, Governance, and Fit for B2B and SaaS Teams
Once score tiers are live, the next step is simple to say and harder to do: figure out whether the model is right, steady, and safe enough to use day to day.
Metrics That Matter More Than Accuracy
Accuracy is a poor lead-scoring metric because qualified opportunities are rare.
What matters more is the tradeoff between precision and recall.
Precision shows how many leads the model marks as positive are actually worth working. Recall shows how many real opportunities the model catches in the first place. Those two measures push against each other. If you increase the score threshold, precision usually goes up, but more real opportunities get missed.
That tradeoff should match the team using the model. A small SDR team with tight bandwidth should usually lean toward precision. A demand-gen team that cares more about not missing target accounts may want recall, even if that means dealing with more false positives.
The third metric many teams miss is calibration. If a lead gets a 40% score, it should convert about 40% of the time during the outcome window. If calibration is off, your Hot/Warm/Cold tiers can point people in the wrong direction even when the ranking itself looks good. So those thresholds need to be checked against precision, recall, and calibration, not just raw score bands.
One example makes the point pretty clearly. Top-decile lift increased from 1.6× to 2.9× versus a rule-based baseline, but SQL-to-close dropped from 21% to 19%, and monthly closed-won revenue slipped from $2.48 million to $2.41 million. A model can look better on paper and still hurt the numbers that leadership cares about.
That’s why model review has to stay tied to downstream results, including:
- opportunities created
- pipeline generated
- win rate
- revenue
Those same measures should remain part of post-launch monitoring too.
Monitoring, Explainability, and Responsible Data Use
After launch, score quality can drift even if the model keeps running without errors.
Teams should track four layers on a steady basis: input health like feature distributions, missing fields, and identity match rates; model behavior like score distributions, tier volumes, and explanation stability; outcome performance like precision, recall, calibration, lift, pipeline, win rate, and revenue; and governance like access logs, consent records, overrides, and version changes. Set alert thresholds for each layer, and give each one a named owner. Retrain when drift passes a set limit, after major pricing or product changes, or when conversion rates fall.
For sales and marketing users, explanations should be short and useful. They do not need model internals. They need to know what changed and what action makes sense now.
For example, a lead record might explain that the account matches the target employee range, two contacts attended the pricing webinar, and the product trial reached the activation milestone, while no buying committee role is identified and the last activity was 21 days ago.
That kind of explanation helps because it shows both positive and negative signals, and it points toward a next step.
Governance also needs clear boundaries. Use role-based access so sales reps can see scores and approved drivers, while data-science and admin teams manage setup and sensitive fields. Collect only the data needed for the stated purpose, keep consent records when required, and define retention and deletion schedules. NIST's AI Risk Management Framework puts focus on governance, measurement, management, explainability, privacy, and fairness.
When Deep Learning Fits B2B and SaaS Teams Best
Deep learning works best for teams that can support monitoring, retraining, and governance over time. It tends to shine when the signals are sequential or unstructured, such as event streams, long product-usage histories, job-title text, or journeys that involve many contacts inside one account.
If your team has limited labeled data, messy CRM hygiene, few qualified outcomes, or no one to own monitoring and retraining, a well-tuned logistic regression or gradient-boosted tree will often give better risk-adjusted value. Put plainly: a simple model that sales trusts is worth more than a complex one nobody wants to use.
| Dimension | Deep Learning Advantage | Deep Learning Disadvantage | Implementation Effort | Maturity Fit |
|---|---|---|---|---|
| Prediction quality | Learns nonlinear interactions across account, contact, behavioral, text, and product-usage signals | Requires sufficient volume and consistent labels; can overfit noisy data | High: data pipelines, training, serving, monitoring, and retraining | Mature B2B teams and product-led SaaS organizations |
| Sequential behavior | Models timing, frequency, and changing intent across a lead or account journey | More difficult to validate, explain, and maintain than static models | High | SaaS teams with reliable event histories and B2B teams with long, instrumented journeys |
| Unstructured and high-cardinality data | Embeddings can represent job titles, free text, industries, and other sparse fields | Additional privacy, bias, storage, and interpretation concerns | Medium to high | Teams with enough text and strong data governance |
| Sales usability | Can identify nuanced patterns and prioritize limited rep capacity | Complex scores lose value if drivers and recommended actions are unclear | Medium to high | Teams with established RevOps ownership and feedback loops |
| Cost and maintenance | May improve lift, pipeline, and revenue when incremental signals are material | Higher engineering, compute, monitoring, and governance costs | High | Organizations able to support ongoing model operations |
| Small or immature datasets | Can eventually scale as data volume grows | Usually inferior to simpler, transparent methods when conversions are scarce or CRM data is incomplete | Low initial effort but high relative maintenance burden | Early-stage teams should start with rules or simpler predictive models |
FAQs
When should I use deep learning for lead scoring?
Use deep learning for lead scoring when simpler models, like logistic regression or random forests, stop doing the job. It tends to work best with large datasets and messy, unstructured data, such as email sentiment, social media interactions, or long-form conversation text.
The trade-off is cost and complexity. Deep learning takes serious computing power and can act like a black box, so it makes the most sense when top-tier predictive accuracy matters most and your team has the technical setup to handle it.
What data do I need to train a lead-scoring model?
You need a clean historical dataset that links lead attributes to conversion outcomes.
That means pulling in demographic and firmographic details like job title, company size, industry, and revenue, along with behavioral signals such as website visits, email engagement, and product usage.
A typical training window is 6 to 24 months of data. And this part matters a lot: clean the data before you use it. Deduplicate records, standardize free-text fields, and keep CRM stage definitions consistent.
How do I turn model scores into sales actions?
Map each score tier, often 0–100, to a CRM or workflow action. Start by storing the raw probability, then turn it into a rounded score. From there, set High, Medium, and Low bands based on what your sales team can actually handle.
For High scores, send instant sales alerts and kick off outreach right away. For mid-range scores, move leads into personalized nurture tracks. For low scores, keep them in nurture until they show more intent.
Scores should update when new events come in. And reps shouldn’t be left guessing - show them the main factors behind each score so they can understand why a lead landed where it did.
Related Blog Posts
Get new content delivered straight to your inbox

The Response
Updates on the Reform platform, insights on optimizing conversion rates, and tips to craft forms that convert.



Drive real results with form optimizations
Tested across hundreds of experiments, our strategies deliver a 215% lift in qualified leads for B2B and SaaS companies.
