
.webp)
Lead Scoring Metrics in PyCaret



If I had to boil this down to one point, it’s this: a good lead-scoring model is not just about high Accuracy. It needs to rank leads well, hit the right Precision/Recall balance, use a clear cutoff, and output scores that match actual conversion rates.
If you use PyCaret for lead scoring, I’d focus on five checks first:
- Set up the data right by crafting killer lead forms: one row per lead, binary target, and no ID fields in training
- Compare models by the metric that fits your sales process: often AUC, F1, Recall, or Precision
- Look past the leaderboard: check the confusion matrix to see false positives and false negatives
- Pick a threshold on purpose: a cutoff controls who goes to sales and who goes to nurture
- Calibrate probabilities before export: a score of 80 should mean about an 80% chance, not just “ranked high”
A few plain-English takeaways:
- AUC tells me how well the model sorts converters above non-converters
- Recall tells me how many good leads I miss
- Precision tells me how much sales time I waste
- F1 helps when I need a middle ground
- Calibration matters if I want to use scores for routing, forecasting, or budget decisions
I’d treat this article as a playbook for reviewing whether a PyCaret lead-scoring model is ready for day-to-day use, not just whether it looks good in a report. This process starts with creating high-converting lead forms that capture the right signals for your model.
How to EASILY get the BEST Machine Learning Model with PyCaret (PyCarrot?) - AutoML in Python
sbb-itb-5f36581
Set Up a PyCaret Classification Experiment for Lead Scoring
Start with setup(), then compare models and inspect the metric registry. These settings shape how PyCaret scores leads and how steady those scores stay in production.
Initialize setup() with the target, ignored fields, and reproducible settings
PyCaret classification begins with setup(). Pass your lead table, which you can build using multi-step lead generation templates, name the target column, leave out ID fields, and use a fixed random seed:
from pycaret.classification import setup, compare_models, get_metrics

clf_exp = setup(
    data=df,
    target='Converted',
    ignore_features=['LeadID', 'AccountID'],
    session_id=42,
    fold=5,
    fold_shuffle=True,
    normalize=True,
    silent=True
)
session_id=42 makes runs reproducible. fold=5 gives you a practical 5-fold cross-validation baseline. If you want a steadier model comparison, use 10 instead. fold_shuffle=True helps when lead data is stored in chronological order, since it reduces the chance that time-based patterns skew the splits. And ignore_features leaves those columns out of training only.
Use compare_models() to generate the metric leaderboard
After setup() finishes, compare_models() ranks models by the metric you choose.
best_model = compare_models(sort='F1')

from pycaret.classification import pull
leaderboard = pull()
print(leaderboard.head())
Pick the sort metric based on business cost. That part matters more than people think.
| Sort Metric | When to Use It |
|---|---|
Recall |
Missing a converted lead is very costly, such as in enterprise B2B sales or high-value deals |
AUC |
You need reliable score rankings across thresholds for segmentation or tiered follow-up |
F1 |
You need a balance between Precision and Recall, especially with imbalanced lead data |
Precision |
False positives waste outreach |
A common pattern is to start with compare_models(sort='AUC') to find models that rank leads well, then review Recall and F1 before making a choice. The leaderboard is useful, but it won't show class-specific errors. For that, you'll want to check the confusion matrix next.
Review the metric registry before choosing a model
Once the top model is ranked, check which metrics PyCaret is using before you commit to a cutoff. get_metrics() lets you confirm the active metric set:
metrics = get_metrics()
print(metrics)
You can also use add_metric() to add a business-weighted metric, like a score that penalizes false negatives more heavily.
from pycaret.classification import add_metric

def cost_sensitive_score(y_true, y_pred):
    from sklearn.metrics import confusion_matrix
    tn, fp, fn, tp = confusion_matrix(y_true, y_pred).ravel()
    cost = 3 * fn + 1 * fp
    return -cost

add_metric(
    id='cost_sensitive',
    name='Cost Sensitive Score',
    score_func=cost_sensitive_score,
    greater_is_better=True
)
After you add it, the metric appears in the leaderboard and can be used as the sort key in compare_models(sort='cost_sensitive'). Once the registry is set, review Precision, Recall, F1, and the confusion matrix.
Read the Core Classification Metrics and Confusion Matrix
Read Precision, Recall, F1, and the confusion matrix before you touch threshold tuning. Those numbers tell you where the model helps sales and where it gets in the way. A leaderboard rank might look nice, but it doesn’t tell you if the model is sending the right leads to SDRs. Use these four metrics first to decide if the model is ready for the next step.
Interpret Precision, Recall, F1, and Accuracy in a lead scoring context
Each metric answers a different business question:
| Metric | Business use |
|---|---|
| Precision | Controls SDR efficiency - high Precision cuts outreach to leads that won’t convert |
| Recall | Controls revenue coverage - high Recall keeps missed converters low |
| F1 | Balances both; most helpful when positive events are rare and costly to miss |
| Accuracy | Use as a secondary check only; it can hide class imbalance. Accuracy can look strong even when the model misses most converters |
For most lead scoring teams, the practical order is simple: Recall and F1 come first for lead capture, Precision matters for SDR efficiency, and Accuracy sits in the background as a gut check rather than the main signal.
Once you’ve looked at the summary metrics, inspect the error types directly.
Use the confusion matrix to inspect false positives and false negatives
After you pick your top model, generate the confusion matrix with plot_model():
from pycaret.classification import plot_model

plot_model(best_model, plot='confusion_matrix')
This creates a 2×2 heatmap with True labels on the Y-axis and Predicted labels on the X-axis. Each cell ties to a sales outcome:
- True Positives (TP): Correctly prioritized leads - the model is doing its job.
- False Positives (FP): High-intent flags on leads that didn’t convert. FP burns sales time.
- False Negatives (FN): Converters the model missed. FN leaves revenue on the table.
- True Negatives (TN): Leads correctly filtered out and sent to nurture.
This is where the real tradeoff shows up. FP and FN pull in opposite directions, and that tension drives the threshold decision. Most teams would rather accept more false positives than let false negatives climb, because missed converters cost more than extra outreach. If false negatives start to rise, lower the routing threshold.
Next, check AUC, threshold choice, and calibration so you can turn these tradeoffs into scores the sales team can actually use.
Check AUC, Thresholds, and Calibration Before Using Scores
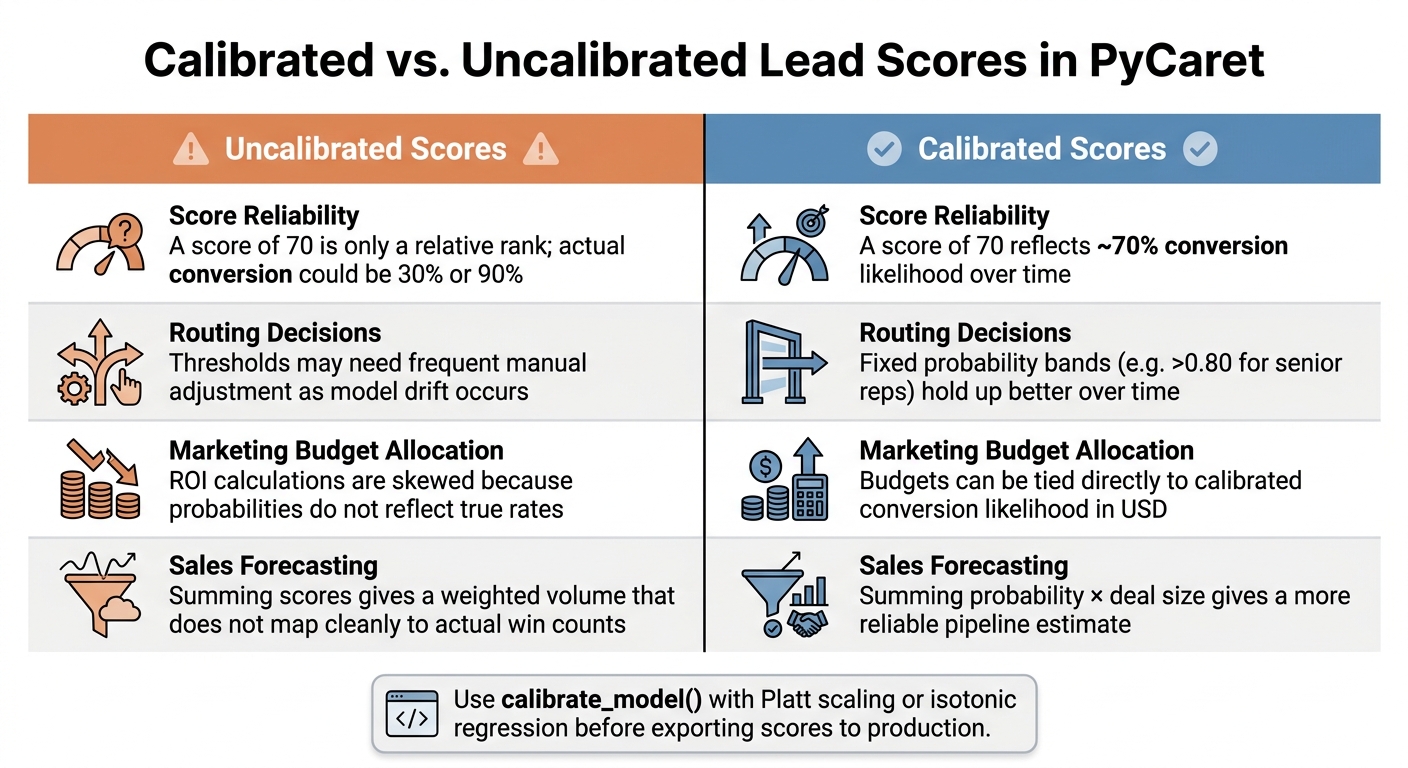
PyCaret Lead Scoring Metrics: Calibrated vs Uncalibrated Scores
After the confusion matrix, make sure the model does three things well: rank leads, support a usable cutoff, and produce scores you can trust.
Use AUC and threshold analysis to choose a routing cutoff
AUC tells you how well the model ranks leads. For example, if a model has an AUC of 0.82, it will rank a true converter above a non-converter 82% of the time. That makes AUC a good way to compare models. It is not the rule you use for setting your MQL cutoff.
plot_model(best_model, plot='auc')
Once AUC shows the model ranks leads well, move to the threshold plot to choose the cutoff for routing:
plot_model(best_model, plot='threshold')
This chart shows Precision, Recall, and F1 at every possible cutoff. It also includes a dashed vertical line at the threshold that maximizes F1.
Here’s the practical read:
- Use a higher threshold when Precision matters more and you want fewer weak leads passed to sales.
- Use a lower threshold when Recall matters more and you’d rather catch more possible converters.
If you’ve picked a cutoff, the next step is simple: check whether the probabilities behind that cutoff are reliable enough to use.
Check probability calibration for reliable lead scores
Calibration checks whether a score matches real conversion odds. So if a lead gets a 0.75 score, calibration asks: does that lead convert about 75% of the time?
Run the calibration plot with:
plot_model(best_model, plot='calibration')
If the curve falls below the diagonal, the model is overconfident. If it sits above the diagonal, the model is underconfident.
When that gap is large, use calibrate_model() before sending scores into production. This applies Platt scaling or isotonic regression so the probabilities line up better with what happens later.
That check tells you whether the scores are ready to export.
Compare calibrated and uncalibrated outputs before rollout
Before rollout, compare calibrated and uncalibrated scores on a holdout set.
| Dimension | Uncalibrated Scores | Calibrated Scores |
|---|---|---|
| Score reliability | A score of 70 is a relative rank; actual conversion could be 30% or 90% | A score of 70 reflects roughly a 70% conversion likelihood over time |
| Routing decisions | Thresholds may need frequent manual adjustment as model drift occurs | Fixed probability bands, such as >0.80 for senior reps, hold up better over time |
| Marketing budget allocation | ROI calculations are skewed because probabilities don't reflect true rates | Budgets can be tied more directly to calibrated conversion likelihood in USD |
| Sales forecasting | Summing scores gives a weighted volume that doesn't map cleanly to actual win counts | Summing probability × deal size gives a more reliable pipeline estimate |
Once calibrated scores hold up on the holdout set, push those scores into your CRM or marketing workflow. Write down the chosen threshold and the calibration method in your playbook so sales and marketing know what a score of 65 or 80 means in day-to-day use.
Export only the calibrated version after the cutoff and score meaning are documented.
Export Lead Scores and Use Them in a Marketing Workflow
Score new leads with predict_model() and build a 0-100 scale
After calibration, the next step is turning model output into lead scores your sales and marketing teams can actually use.
Run predict_model() on new leads. It returns prediction_label and prediction_score. From there, you can turn that output into a 0–100 conversion score by using the positive-class probability and flipping negative predictions.
scored_leads = predict_model(calibrated_model, data=new_leads)
This is where model evaluation stops being a data exercise and starts driving follow-up.
scored_leads['lead_score'] = scored_leads.apply(
    lambda row: round(row['prediction_score'] * 100)
    if row['prediction_label'] == 1
    else round((1 - row['prediction_score']) * 100),
    axis=1
)
In plain English, a lead that looks very likely to convert gets a score closer to 100. A lead that looks unlikely to convert lands closer to 0. That gives your team a simple number they can sort, filter, and route without digging through model output.
Export results to CSV, databases, or CRM workflows
Once the score is set, export it into the systems that control follow-up.
# CSV export
scored_leads.to_csv('scored_leads.csv', index=False)

# Database export
scored_leads.to_sql('lead_scores', con=db_engine, if_exists='replace', index=False)
Include the lead ID, email, raw probability, label, 0–100 score, and Scored_At timestamp. Those fields give you what you need for routing, reporting, and later reviews.
If leads come in through Reform, its validation, enrichment, and CRM integrations help keep records clean before scoring.
Conclusion: The metric review steps that matter most
At this stage, the metric review is done. What comes next is routing leads in a way your team can act on.
Define the target clearly. Run setup() with lead IDs in ignore_features. Use compare_models() based on the metric that fits your goal. Check the confusion matrix to weigh false positives against false negatives. Review AUC and calibration. Then export calibrated scores with a documented threshold.
A simple routing setup might look like this:
- Send top-scoring leads to sales
- Move mid-tier leads into nurture
- Suppress low-quality leads
The metric review is not a one-and-done task. It’s the part of the process that keeps scores useful over time. Document your chosen threshold, your calibration method, and what each score band means in day-to-day use.
FAQs
How do I choose the best threshold?
Choose the best lead scoring threshold by lining up model output with your sales team’s capacity and your service-level agreements. A score only works if your team can act on it.
Start by converting raw probabilities to a 0–100 scale. Then test different cutoffs against past performance to see where you get stronger conversion lift.
You’ll also want to review score distribution on a regular basis, along with MQL-to-SQL conversion rates. The goal is simple: higher scores should lead to better outcomes. If that pattern starts to fade, your cutoff may need work.
Team feedback matters here too. If reps keep flagging bad-fit leads with false-positive tags, use that input to adjust your thresholds every quarter.
When should I prioritize Precision over Recall?
Prioritize Precision when sales capacity is tight and you need leads marked as hot to have a strong chance of converting. That helps cut wasted sales time and keeps reps focused on the right people.
Prioritize Recall when missing qualified leads is expensive, like in enterprise sales where the goal is to spot as many high-value prospects as possible.
How often should I recalibrate lead scores?
Do light threshold checks every month and run full reviews every quarter. That helps keep scoring accurate and makes it easier to spot model drift before it turns into a bigger problem. If you're in a fast-moving market, switch full reviews to a monthly cadence.
Recalibrate earlier if performance slips, lead volume changes out of nowhere, or your score bands no longer line up with actual conversion rates. Bring sales into the review process too, so the model stays in sync with team capacity and service-level agreements.
Related Blog Posts
Get new content delivered straight to your inbox

The Response
Updates on the Reform platform, insights on optimizing conversion rates, and tips to craft forms that convert.


Drive real results with form optimizations
Tested across hundreds of experiments, our strategies deliver a 215% lift in qualified leads for B2B and SaaS companies.
