
.webp)
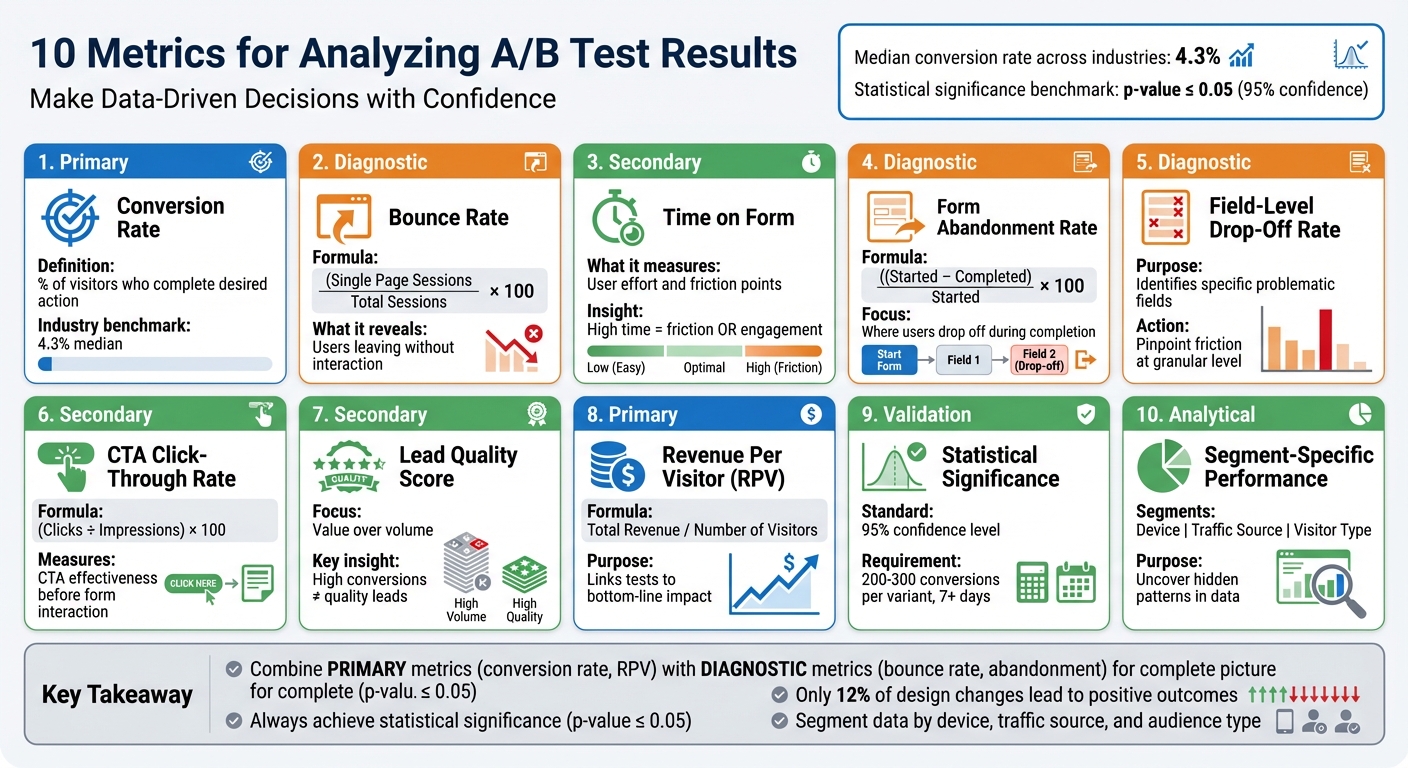
10 Metrics for Analyzing A/B Test Results


A/B testing is all about making data-driven decisions instead of guessing. But to get results you can trust, you need to track the right metrics. This article breaks down 10 key metrics that help you measure A/B test performance effectively, ensuring your decisions lead to better outcomes. Here's what you'll learn:
- Conversion Rate: The percentage of visitors who take the desired action (e.g., form submissions).
- Bounce Rate: Tracks users who leave without interacting, highlighting engagement issues.
- Time on Form: Measures how long users spend on forms to identify friction or efficiency.
- Form Abandonment Rate: Pinpoints where users drop off during the form completion process.
- Field-Level Drop-Off Rate: Identifies specific form fields causing user frustration.
- Call-to-Action Click-Through Rate (CTR): Evaluates how well your CTA drives user interaction.
- Lead Quality Score: Focuses on the value of leads, not just the volume.
- Revenue Per Visitor (RPV): Links test performance to financial outcomes.
- Statistical Significance: Ensures results are reliable, not random.
- Segment-Specific Performance: Breaks down results by device, traffic source, or audience type.
Key takeaway: Combining primary metrics (like conversion rate) with diagnostic ones (like bounce rate) gives you a clear picture of what’s working and what’s not. Use tools like real-time analytics and segment data to refine your forms and improve results. Always aim for statistical significance (p-value ≤ 0.05) to ensure your findings are accurate and actionable.
10 Essential A/B Testing Metrics for Form Optimization
1. Conversion Rate
Primary Metric vs. Supporting Metric
Conversion rate is the cornerstone of A/B testing. It represents the percentage of visitors who take the desired action - like completing a form or making a purchase. While secondary metrics, such as click-through rate or bounce rate, help provide additional context, conversion rate directly shows whether your test variant has achieved its intended business goal. For forms, this often means measuring how many visitors submit the form compared to the total number of page visitors. Grasping this metric is essential for evaluating how your changes impact form performance.
Relevance to Form Performance
Conversion rate is a clear indicator of how effective your forms are, making it a critical measure in A/B testing. On average, the median conversion rate across industries is about 4.3%. However, what qualifies as a "good" conversion rate depends on your industry and the type of form you're using. When testing elements like field length, layout, or the placement of a call-to-action (CTA), the conversion rate shows whether your adjustments are leading to more submissions. To ensure your results are reliable, aim for statistical significance, typically with a p-value of 0.05 or lower.
Actionable Insights for A/B Test Optimization
To improve conversion rates, experiment with variables such as form placement, the number of fields, CTA design (like color or wording), use of social proof, and page load speed. These factors can significantly influence user behavior and drive better results.
| Metric Type | Example for Forms |
|---|---|
| Primary | Form Completion Rate |
| Secondary | Click-Through Rate on form link |
| Diagnostic | Abandonment/Bounce Rate |
Alignment with U.S.-Based Reporting Standards
When sharing conversion rate data with U.S. stakeholders, it's important to follow standard practices. Use the MM/DD/YYYY date format and report any revenue-related metrics in USD. For example, if you're also tracking Revenue Per Visitor alongside conversion rate, you might present it as $45.32. This ensures consistency and clarity across teams, aligning with typical U.S. business reporting norms. The same level of precision should be applied to all metrics discussed in this article for effective communication.
2. Bounce Rate
Primary Metric vs. Supporting Metric
Bounce rate acts as a helpful diagnostic tool in A/B testing, offering insights into why your conversion rate might be underperforming. It calculates the percentage of visitors who land on your form page but leave without taking any further action. The formula is: Bounce rate = (Single Page Sessions / Total Sessions) x 100. While the conversion rate focuses on whether visitors complete your form, bounce rate highlights how well you’re engaging them right from the start. For instance, if a variant has a higher conversion rate but also an increased bounce rate, it could point to technical problems like slow page loading. This metric provides a clearer picture of how visitors behave early in their journey.
Relevance to Form Performance
A high bounce rate often signals performance issues, particularly when visitors leave without interacting. This could mean that key aspects - like your headline or the initial design - aren’t grabbing their attention. It’s important to distinguish bounce rate from form abandonment rate, which tracks users who start filling out the form but don’t finish. If you notice a high bounce rate paired with low scroll depth, it’s a sign that users are losing interest before they even get past the top of the page ("above the fold"). This suggests that improving the opening content could make a big difference.
Actionable Insights for A/B Test Optimization
To lower bounce rates during A/B testing, consider these strategies:
- Speed up page loading times: Visitors are quick to leave if a page takes too long to load.
- Fine-tune your headline and offer: Make sure they align with what visitors are looking for and grab their attention immediately.
- Improve page layout: Guide visitors smoothly toward the form with a clean, intuitive design.
- Boost your call-to-action (CTA): Use eye-catching colors and clear, action-driven language like "Sign Up Now" or "Get Started."
Alignment with U.S. Reporting Standards
When presenting bounce rate data to U.S.-based stakeholders, ensure your reporting aligns with local standards. Use the MM/DD/YYYY format for test dates (e.g., 06/18/2024 to 07/02/2024). If you’re tracking bounce rate alongside revenue data, always display financial figures in U.S. dollars (USD) to maintain consistency across your reports and dashboards.
3. Time on Form
Primary Metric vs. Supporting Metric
Time on Form acts as a secondary or diagnostic metric rather than a primary measure of success [5, 14]. While the conversion rate shows whether users completed your form, Time on Form highlights the effort involved. It’s calculated by dividing the total time spent on the form by the number of visits [5, 9].
Relevance to Form Performance
A longer Time on Form can mean different things: it might reflect thorough engagement or signal friction [6, 9]. For example, high Time on Form could point to issues like overly complex fields, unclear labels, or even technical glitches. On the other hand, if low Time on Form is paired with high conversion rates, it suggests a smooth and efficient process. Analyzing this metric alongside other data, like scroll depth, can uncover specific problem areas - for instance, a high time spent but low scroll depth may indicate users are stuck at the top of the form.
"Average time on page... provides info on how effectively it captures and holds users' attention." - Stymix Team
These insights can guide targeted improvements to enhance user experience.
Actionable Insights for A/B Test Optimization
If Time on Form is unusually high, session recordings can help identify whether users are struggling with unclear instructions or problematic field validations. When extended form times lead to abandonment, the issue often lies in the final fields or near the submission button [6, 9]. To address this, consider simplifying the form by reducing the number of fields, adding helpful example text, or including a progress bar [13, 9]. Also, analyze performance by device type - mobile users tend to take longer to complete forms.
Alignment with U.S. Reporting Standards
For U.S.-based users, ensure consistency by using the MM/DD/YYYY date format and displaying currency in USD ($). This reduces potential confusion and minimizes the time users spend correcting errors. For example, report test durations and dates like 12/21/2025 to 01/04/2026 to maintain clarity in your analytics dashboards.
4. Form Abandonment Rate
Primary Metric vs. Supporting Metric
The Form Abandonment Rate acts as a diagnostic tool in A/B testing, helping you understand where users drop off during the form completion process. While the conversion rate measures overall success, the abandonment rate zeroes in on the exact stage where users decide to leave. Here's how it's calculated:
((Started Form - Completed Form) / Started Form) × 100
It's different from the bounce rate, which tracks users who leave without interacting at all. Instead, the abandonment rate focuses on those who begin filling out a form but don’t finish, making it a key indicator of friction in your funnel.
Relevance to Form Performance
A high abandonment rate signals trouble spots that could be costing you conversions.
"Generally speaking, the greater the abandonment rate, the more likely it is that there are elements on your page causing friction."
- Josh Gallant, Founder of Backstage SEO
Common issues include overly complicated processes, too many fields, unexpected costs, or concerns about security. In A/B testing, the variant with a lower abandonment rate typically offers a smoother experience. Identifying these friction points allows you to make precise adjustments that improve user flow.
Actionable Insights for A/B Test Optimization
When one test variant shows a higher abandonment rate, it's a clear sign that simplification is needed. Consider these strategies:
- Reduce form fields or clarify confusing labels to streamline the process.
- Use exit-intent pop-ups to offer assistance or gather feedback through surveys for deeper insights.
- For users who abandon forms, implement retargeting campaigns via email reminders or ads to encourage them to return.
- In multi-step forms, adding progress bars can help set expectations and motivate users to complete the process.
If you're using Reform's no-code form builder, its real-time analytics and abandoned submission tracking provide valuable tools to identify and address these friction points effectively.
Alignment with U.S. Reporting Standards
Accurate and consistent reporting is essential. When analyzing abandonment rates, follow U.S. reporting standards by formatting test dates as MM/DD/YYYY (e.g., 12/21/2025 to 01/04/2026) and displaying revenue impact in USD ($). This ensures clear communication across teams and accurate tracking of key metrics like Revenue Per Visitor.
5. Field-Level Drop-Off Rate
Primary Metric vs. Supporting Metric
The field-level drop-off rate pinpoints exactly where users abandon your form. While the overall conversion rate provides a general view of form performance, this metric dives deeper to identify specific fields that might be causing frustration or confusion. By comparing drop-off rates between different form versions, you can see how changes like reordering fields or tweaking labels impact user behavior.
Here’s how you can calculate this:
- Total Drop-Offs: The number of users who stopped filling out the form at a specific field.
- Drop-Off Percentage: The percentage of users who abandoned the form at a field, calculated by dividing the number of drop-offs by the total users interacting with that field, then multiplying by 100.
This detailed metric provides clarity on where users encounter friction, offering valuable insights for A/B testing.
Relevance to Form Performance
The field-level drop-off rate takes the guesswork out of form analysis and replaces it with actionable data. For instance, a field near the beginning of your form might have a high number of drop-offs simply because more users reach it. However, a high percentage drop-off rate later in the form often signals a more serious issue.
"Mastering form analysis is a key part of becoming good at conversion rate optimization, particularly if you are dealing with industries that drive a large part of their customer acquisition through their web site."
When A/B testing reveals that a specific form version reduces drop-offs at certain fields, it’s a clear sign that the updates are helping users complete the form more easily.
Actionable Insights for A/B Test Optimization
With this data in hand, focus on fields with high drop-off percentages or those where users frequently change their answers - these often point to confusing instructions or unclear error messages. Tools that track user behavior, like mapping where users jump between fields, can further highlight design flaws. It’s also helpful to segment users by traffic source, as organic visitors may interact with forms differently than those from paid campaigns.
Real-time analytics tools, like Reform, can uncover these patterns across test variants, helping you refine your forms for better performance.
Alignment with U.S. Reporting Standards
When reporting field-level drop-off data, ensure consistency by using the MM/DD/YYYY format for test periods (e.g., 12/21/2025 to 01/04/2026) and displaying any revenue-related metrics in USD ($). These standardized formats make it easier for stakeholders to compare results across different testing cycles and make informed decisions about optimizing forms.
6. Call-to-Action Click-Through Rate
Primary Metric vs. Supporting Metric
Call-to-Action Click-Through Rate (CTR) measures how many people click on your call-to-action (CTA) compared to the total number of impressions, calculated as CTR = (Clicks ÷ Impressions) × 100. While your overall conversion rate focuses on completed form submissions, CTR zeroes in on how compelling your CTA is before users even reach the form fields. It’s a quick way to gauge whether your CTA grabs attention and encourages interaction.
"Click-through rate is a metric every marketer should be tracking on any CTA they have in the wild." - Josh Gallant, Founder, Backstage SEO
If your CTR is low, it could mean your button design, placement, or messaging isn’t connecting with your audience, which may discourage them from engaging with your form.
Relevance to Form Performance
CTR serves as an early indicator during A/B testing. If one version of your form gets fewer clicks on the submit button, it’s a clear signal that the CTA isn’t working as intended. This allows you to address the issue before diving into more complex metrics. Comparing CTRs across different versions of your form can help pinpoint which CTA catches users’ attention and drives action. If you notice a high CTR but a low conversion rate, it suggests that while the CTA is effective, there’s likely friction elsewhere in the form.
Actionable Insights for A/B Test Optimization
Once you’ve identified issues using CTR, improving your CTA can have a big impact on your form’s overall performance. Here are some actionable tips:
- Make it stand out: Use contrasting colors, larger fonts, and clear, action-focused wording. Test phrases like “Get Started” versus “Submit.”
- Adjust placement: Position the button where it aligns naturally with the user’s flow.
- Consider device-specific issues: Analyze data by device type to ensure mobile users, in particular, can easily interact with the button.
Reform’s built-in analytics make this process easier, helping you track changes and refine your forms based on real data.
Alignment with U.S. Reporting Standards
When reporting CTR in the U.S., always express it as a percentage in your A/B test dashboards. Use the MM/DD/YYYY format for test periods (e.g., 12/21/2025 to 01/04/2026). If you’re evaluating the revenue impact of improving CTR, present financial results in USD. Before declaring a winning variant, aim for a 95% confidence level (p-value ≤ 0.05).
sbb-itb-5f36581
7. Lead Quality Score
Primary Metric vs. Supporting Metric
The Lead Quality Score is a secondary metric that evaluates the value of the leads you’re capturing. While conversion rate measures how many people complete your form, lead quality digs deeper, assessing whether those submissions are worthwhile. After all, a high volume of leads is meaningless if they don’t convert into paying customers or valuable prospects.
"The primary metric is the main indicator of success... The secondary metrics can help you understand how performance is improved (although not representative of success)." - Linh Khanh, Content Editor, Userpilot
This distinction is crucial for avoiding misleading results in A/B tests. Sometimes, a variant might seem like a winner because it generates more leads, but those leads might not align with your target audience. Focusing on lead quality ensures that your metrics reflect long-term value, not just short-term numbers.
Relevance to Form Performance
Streamlining your forms - like removing fields - can increase conversion rates but might also reduce the quality of leads. For example, a B2B company targeting large enterprises might see a spike in submissions after removing a "company size" field, only to discover that most of the new leads are freelancers or small businesses. In both B2B and SaaS industries, prioritizing lead quality over sheer volume often leads to more meaningful outcomes in the long run.
Actionable Insights for A/B Test Optimization
To improve your lead capture process, establish clear criteria for what qualifies as a strong lead. For instance, define key attributes like industry, company size, or specific actions such as requesting a demo. When testing changes, keep an eye on metrics like Field-Level Drop-Off to spot adjustments that might attract unqualified leads. Segmenting results by traffic source and device type can help uncover patterns and refine your strategy. Tools like Reform’s real-time analytics and lead enrichment features allow you to monitor and enhance lead quality alongside conversion rates, enabling quicker, more informed decisions.
Alignment with U.S. Reporting Standards
When reporting lead quality, link your findings to financial metrics expressed in U.S. dollars. For example, calculate Average Order Value (AOV) by dividing total revenue by the number of orders, or use Customer Lifetime Value (LTV) to estimate the long-term earnings potential of your leads. Be mindful of seasonal trends - like holiday shopping surges - that could temporarily skew your data. Always ensure statistical significance (p-value ≤ 0.05) before declaring a winning variant. Sometimes, a variant with fewer conversions but a significantly higher AOV might prove more beneficial for your bottom line.
8. Revenue Per Visitor
Primary Metric vs. Supporting Metric
Revenue Per Visitor (RPV) is a key metric in A/B testing because it directly ties your experiments to your bottom line. While metrics like conversion rate show how many users completed a specific action, RPV goes a step further by revealing the financial outcome. It’s calculated by dividing total revenue by the number of visitors during the test period. For instance, if your test generates $10,000 in revenue from 2,000 visitors, your RPV would be $5.00.
"Revenue is the 'north star' metric of most A/B tests, measuring your hypothesis's impact on your bottom line." - Contentsquare
RPV helps you avoid false positives. For example, a test variant might increase form completions by 20%, but if those leads primarily purchase low-margin products, your overall profit could drop. By focusing on RPV, you can measure performance in terms of revenue, ensuring your decisions are financially sound.
Relevance to Form Performance
RPV becomes especially important when evaluating the quality of conversions, particularly for B2B and SaaS companies. While it can take time to fully assess long-term value (LTV), RPV serves as an early indicator of lead quality. For example, simplifying a form might increase submissions, but if those leads don’t generate meaningful revenue, RPV will highlight the issue. Adding a qualifying question - like budget range or company size - can boost RPV by filtering out low-value prospects, even if it results in fewer form completions.
Actionable Insights for A/B Test Optimization
RPV is particularly useful when testing elements like pricing displays, discounts, or upsell opportunities. A premium option might convert fewer visitors but still deliver higher revenue per conversion. To refine your strategy, segment RPV data by device type or traffic source. For example, if mobile RPV is lagging, consider optimizing mobile-specific forms. Run tests for 7–14 days to account for weekly fluctuations and get more reliable data. These steps help ensure your optimization efforts are both precise and impactful.
Alignment with U.S. Reporting Standards
When reporting RPV, display it in USD with two decimal places (e.g., $4.50). Use the MM/DD/YYYY format for test durations, such as 11/01/2025 to 11/15/2025. Be aware of seasonal trends that may influence results, especially during major U.S. shopping periods like Black Friday or the December holidays. Lastly, ensure your test results reach 95% statistical significance before acting on them, as random revenue fluctuations can sometimes skew outcomes.
9. Statistical Significance
Primary Metric vs. Supporting Metric
Statistical significance is a key tool for understanding whether performance changes - like an increase in form completion rates - are genuine or just random fluctuations. The standard benchmark in the field is a 95% confidence level, meaning that if you were to repeat the test 100 times, you'd expect the same results in 95 of those tests. However, research shows that only 20% of A/B tests actually reach this confidence level.
"Statistical significance tells you if you can trust the observed results or not." - Convert.com
The p-value is the metric that quantifies this confidence. A p-value of 0.05 or less indicates there's a mere 5% chance that your observed results are due to random chance. The smaller the p-value, the more likely it is that your changes - like adjustments to a form - are driving the difference, not just random traffic patterns. This makes statistical significance essential when using test results to refine and improve form performance.
Relevance to Form Performance
Statistical significance ensures you’re not fooled by short-term trends or anomalies. Just as you'd validate changes in conversion or bounce rates, you need to confirm that improvements in form performance are reliable. For instance, imagine you reduce the number of fields in a form from 10 to 5 and see a 15% drop in abandonment rates. Without confirming statistical significance, you can't be sure whether that improvement is due to your changes or just a temporary surge in high-quality traffic. Rolling out such a variant prematurely could lead to inconsistent results over time. A/A testing - where you compare your control against itself - helps establish a baseline, which typically shows no more than 2% variance.
Actionable Insights for A/B Test Optimization
Before you start any test, calculate the sample size you'll need. As one expert puts it:
"Any experiment that involves later statistical inference requires a sample size calculation done BEFORE such an experiment starts. A/B testing is no exception."
For forms with lower traffic, aim for 200–300 conversions per variant and let the test run for at least seven days. Avoid checking the p-value daily or stopping the test as soon as it hits 95% significance - this can lead to misleading results, as significance levels often fluctuate during the test period. If your overall results don’t reach significance, try segmenting your data. Breaking it down by device type (e.g., mobile vs. desktop) or visitor type (e.g., new vs. returning) might reveal smaller, hidden opportunities.
Alignment with U.S. Reporting Standards
When presenting results to U.S. stakeholders, use the MM/DD/YYYY date format (e.g., 11/01/2025 to 11/15/2025) and report revenue figures in USD with two decimal places. Keep in mind that seasonal events, like Black Friday or the December holidays, can introduce variability that may skew your results. Always document the significance threshold you used (typically 95%) and the corresponding p-value in your reports. This transparency ensures consistency and builds trust in your findings.
10. Segment-Specific Performance
Primary Metric vs. Supporting Metric
Primary metrics, like conversion rates, provide a snapshot of overall test success. But if you dig deeper into segment-specific performance, you can uncover valuable insights often masked in the overall data. For example, while the overall conversion rate might seem steady, breaking the data down by device type, traffic source, or visitor history can reveal that certain segments are outperforming others - patterns that the average conversion rate simply can’t show.
"Segmenting your audience is a great way to help focus your marketing efforts and better reach your customers - but you can also do it during your test analysis." - Josh Gallant, Founder, Backstage SEO
This kind of segmentation is essential for understanding the finer details of user behavior.
Relevance to Form Performance
Overlooking segmentation in form test data can lead to missed opportunities, particularly when it comes to optimizing for specific groups. For instance, a form variant that reduces the number of fields might not show a noticeable improvement overall. However, when you analyze by visitor type, you might discover that first-time users complete the simplified form at a much higher rate, while returning visitors prefer more detailed fields. Similarly, if a variant performs well on desktops but struggles on mobile, the problem could be tied to mobile-specific issues like small tap areas or slow loading speeds.
Actionable Insights for A/B Test Optimization
To get the most out of your A/B tests, examine form performance across key segments such as device type (mobile vs. desktop), user history (new vs. returning), and traffic sources (organic vs. paid search). If mobile conversions are lagging behind desktop, focus on improving mobile-responsive design rather than scrapping the variant altogether. For revenue-driven forms, track Revenue Per Visitor (RPV) by segment to identify your highest-value audiences. Just make sure each segment reaches statistical significance before making any decisions.
Alignment with U.S. Reporting Standards
When reporting these insights, stick to U.S. conventions. Use USD for financial data and the MM/DD/YYYY format for dates. This ensures your findings are easy to interpret and align with broader test outcomes. It’s especially important during key shopping periods like Black Friday or the holiday season, as consistent reporting helps you compare performance across different time frames and audience segments.
3 Types of A/B Testing Metrics- Use the right ones or fail
Conclusion
Running A/B tests without diving into the right metrics can lead to missed opportunities and overlooked problems. Primary metrics like conversion rate tell you what happened, but it’s the supporting metrics that help you understand why it happened. For instance, if a variant’s conversion rate drops, diagnostic metrics - like bounce rate or page load speed - can help pinpoint whether a technical issue or unappealing content is driving users away. This layered analysis highlights why relying on just one metric can be misleading.
Focusing on a single metric can also hide issues that impact overall revenue. Imagine a form variant that doubles your "add to cart" rate, but at the same time, the Average Order Value (AOV) plummets. In this scenario, your revenue takes a hit despite the initial success. To avoid such pitfalls, it’s crucial to look at multiple data points - conversion rates, abandonment rates, field-level drop-offs, and performance across different audience segments. Together, these metrics provide the clarity needed to make informed decisions.
Modern tools make managing this complexity easier. Reform’s real-time analytics dashboard tracks conversion rates, flags incomplete submissions, and pinpoints exactly where users are dropping off. With built-in A/B testing features and seamless CRM integrations, you can analyze performance across segments - like mobile vs. desktop users or new vs. returning visitors - all without switching between platforms.
A thorough approach that combines primary and diagnostic metrics is key to effective A/B test analysis. Across industries, the median conversion rate stands at 4.3%, and only 12% of design changes lead to positive outcomes. By blending these metrics, ensuring statistical significance (p-value ≤ 0.05), and segmenting your audience, you can replace guesswork with a reliable, data-driven process. This method ensures your optimization efforts lead to meaningful improvements in both form performance and business results.
FAQs
How can I achieve statistical significance in my A/B test results?
To ensure your test achieves statistical significance, start by clearly defining your hypothesis and setting a confidence level - 95% (p ≤ 0.05) is the standard choice. Before launching the test, calculate the minimum sample size using a power analysis. This step considers key factors like the expected lift, baseline conversion rate, and desired power (commonly set at 80%). By doing this, you’ll collect enough data to detect meaningful differences while minimizing the risk of false positives.
During the testing phase, maintain a random and consistent traffic allocation - typically a 50/50 split - until you reach the required sample size. Resist the temptation to check results too early, as stopping prematurely can lead to misleading conclusions. When the test is complete, apply suitable statistical methods, such as a chi-square test or a two-proportion z-test, to evaluate whether the observed differences are statistically significant.
Real-time analytics tools, like Reform, can be invaluable for tracking sample sizes, conversion rates, and confidence intervals throughout the test. These tools help ensure you’re on the right path. Once the confidence interval no longer overlaps with the null hypothesis, you’ll know it’s safe to implement the winning variation with confidence in the results.
What’s the difference between conversion rate and lead quality score?
The conversion rate represents the percentage of visitors who complete a specific action, like filling out a form or making a purchase. It’s a simple yet powerful way to gauge how well your page or form encourages users to take the next step.
In contrast, a lead quality score assesses the value or relevance of a lead by considering factors such as their intent, fit, or other data points. While the conversion rate highlights the number of actions, the lead quality score zeroes in on the value of those actions, helping you focus on leads with the highest potential to become customers.
What are the best ways to reduce form abandonment rates?
Simplifying the user experience is the first step to reducing form abandonment. Start by keeping the number of fields to a minimum - only ask for the information you absolutely need. If the form feels overwhelming, consider breaking it into multi-step sections with a clear progress bar to make it feel more approachable. Adding short, helpful notes (microcopy) next to fields and allowing flexible input formats, like accepting different phone number styles, can also help prevent frustration.
Trust is key, too. Include visible security badges and clear privacy statements to reassure users that their information is safe. And since so many people fill out forms on their phones, make sure your form is mobile-friendly. Use large, easy-to-tap buttons, ensure pages load quickly, and design with responsive layouts to keep smartphone users from dropping off.
To fine-tune your forms, track important metrics like conversion rates, exit rates, and time spent on the form. Small tweaks, like changing button text or rearranging fields, can make a big difference. By regularly testing and improving your forms, you can boost completion rates and gather more qualified leads over time.
Related Blog Posts
Get new content delivered straight to your inbox

The Response
Updates on the Reform platform, insights on optimizing conversion rates, and tips to craft forms that convert.


Drive real results with form optimizations
Tested across hundreds of experiments, our strategies deliver a 215% lift in qualified leads for B2B and SaaS companies.
